
Manual (legacy)
The Manual dashboard gives access to the statistics for Manual Task processing.
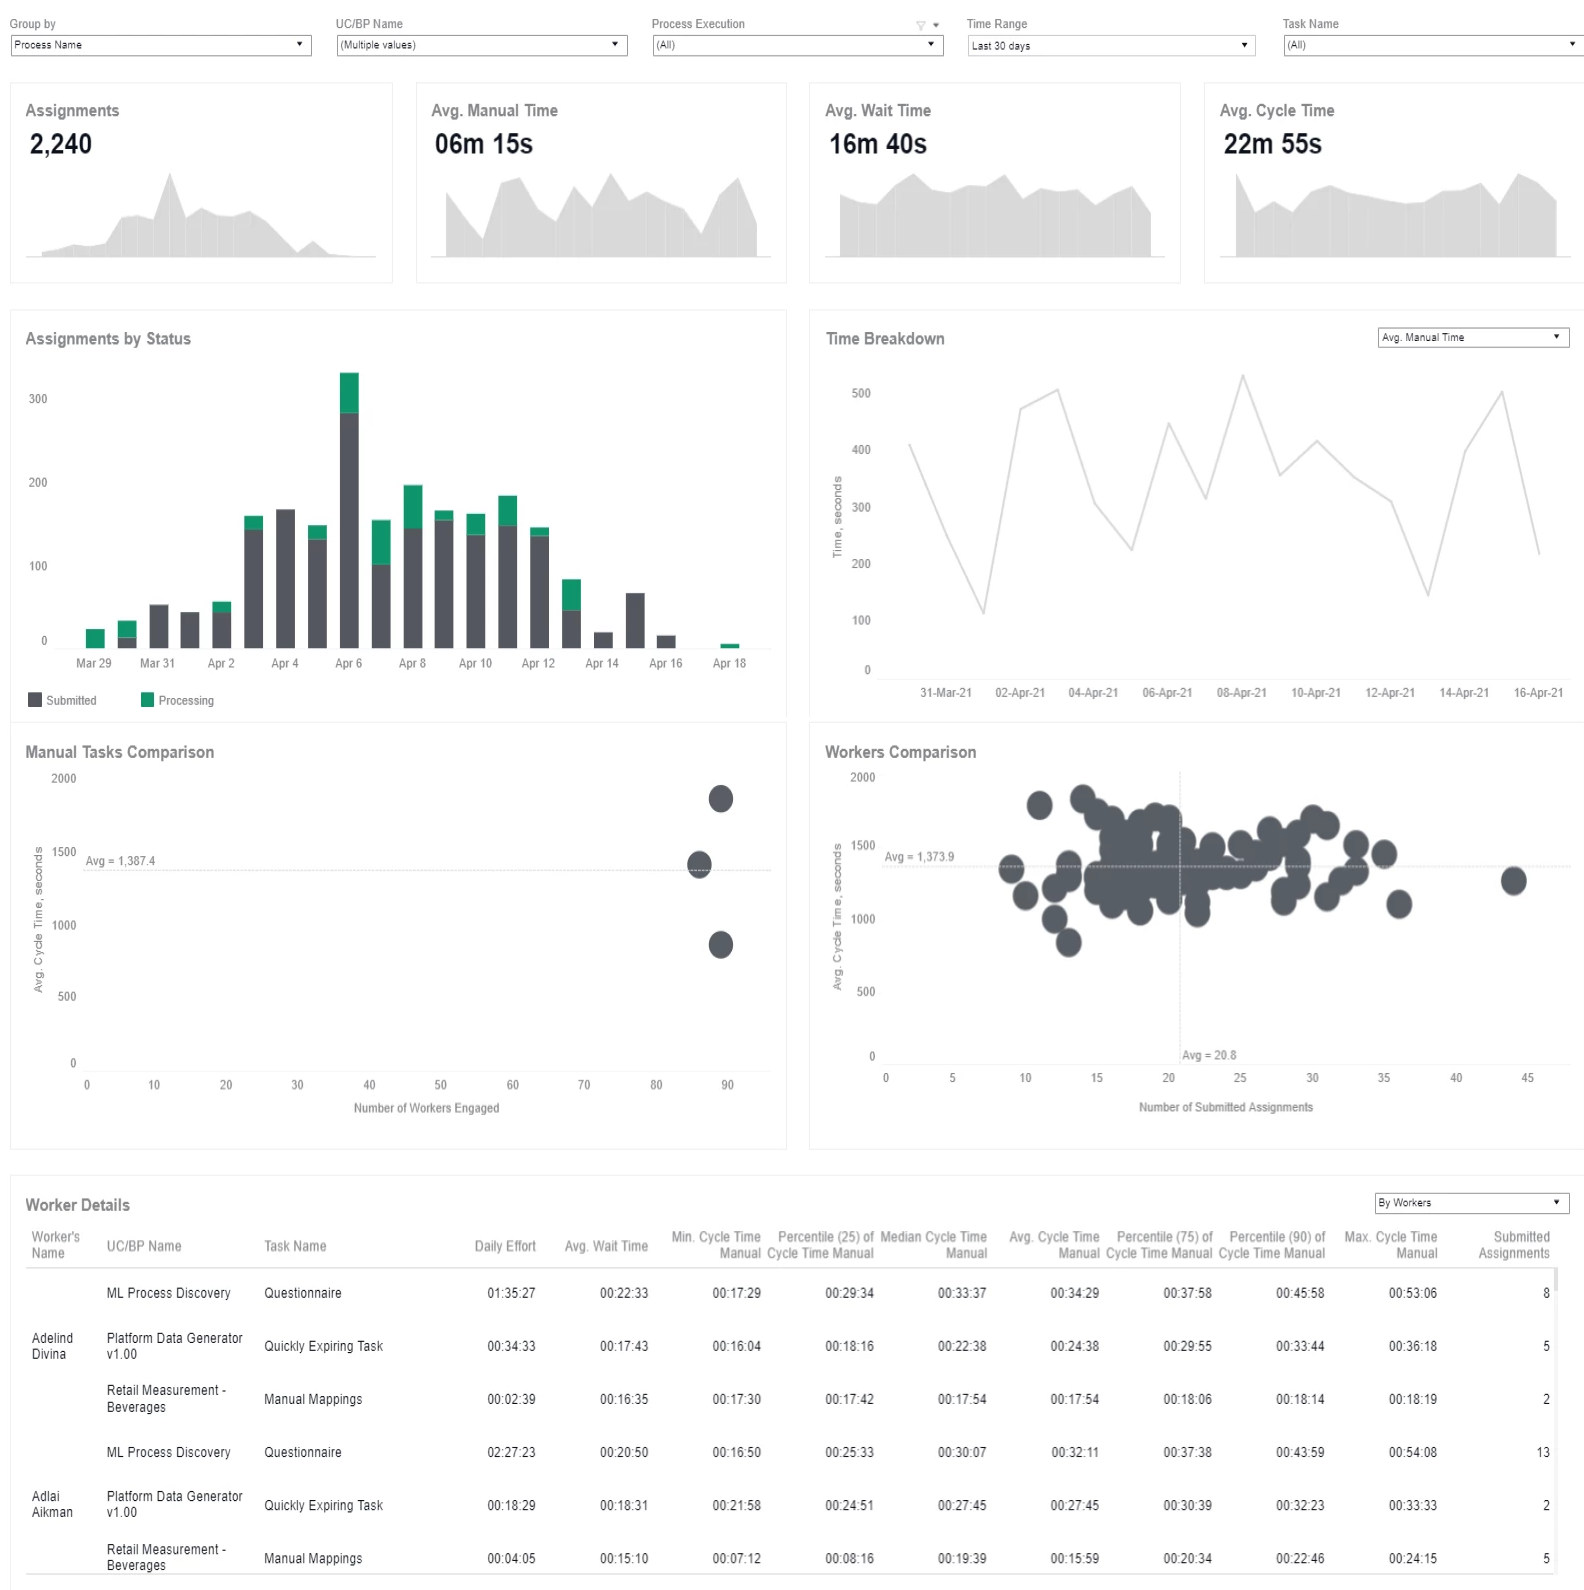
For detailed information, refer to the Views section.
When using the Manual dashboard, pay attention to the following considerations:
For the dashboard, data selection is limited to process executions over 30 days.
All time axes (KPI, volume, and speed) are linked to the process execution start date.
Filtering
The Manual dashboard features the following filtering options:
- Group by allows you to specify whether the information is presented by individual Business Processes (default option) or by Use Cases.
- Name limits the view to specific Business Processes or Use Cases, depending on the Group by selection.
- Process Execution Start Date limits the display of process execution data to a specific period.
- Task Name allows selecting an individual task by the name.
Views
Key Performance Indicators

The Key Performance Indicators view provides the following information supported by daily trend visualizations:
- Total number of Manual Tasks.
- Average Processing Time per Manual Task, same as Manual Handling Time indicating actual manual efforts.
- Average Waiting Time per Manual Task, meaning how long, on average, Manual Tasks reside in queues without being accepted.
- Average Cycle Time per Manual Task, meaning the average time required for end-to-end processing of a single Manual Task.
Volume
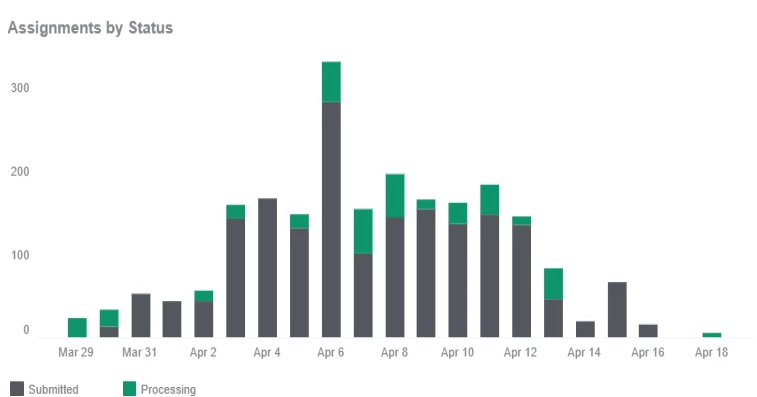
The Volume view extends KPIs, providing daily insights into Manual Task volumes broken down by the statuses:
- Completed: the assignment is submitted.
- Processing: the assignment is accepted but not completed yet.
Speed
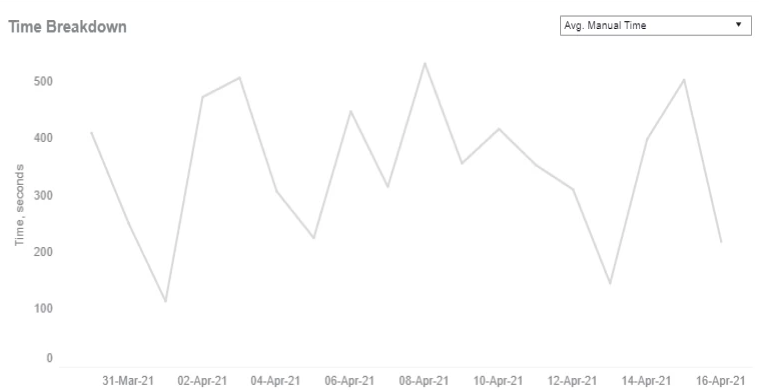
The Speed view provides information on daily average processing times and allows you to select different time components, such as:
- Processing Time: how long it takes to process a Manual Task.
- Waiting Time: how long Manual Tasks reside in queues without being accepted.
- Cycle Time: how long it takes to process a single Manual Task end-to-end.
Manual Tasks Comparison
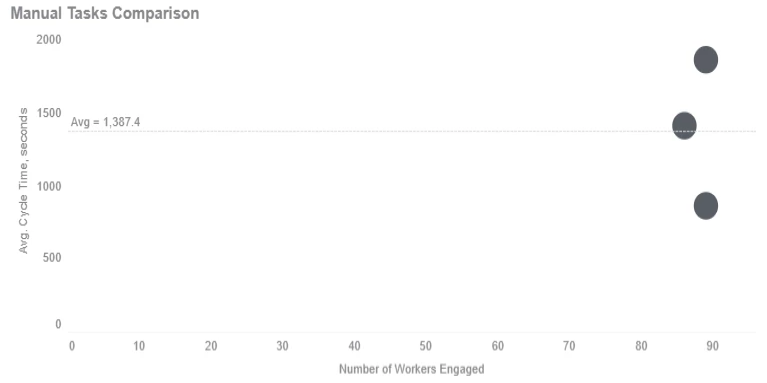
The Manual Tasks Comparison view allows you to compare tasks by the average cycle time and the number of involved workers.
To compare the average times of different tasks, the Average Cycle Time value is calculated as the average of averages. Each circle represents a single task and includes all submissions with average execution metrics.
Workers Comparison
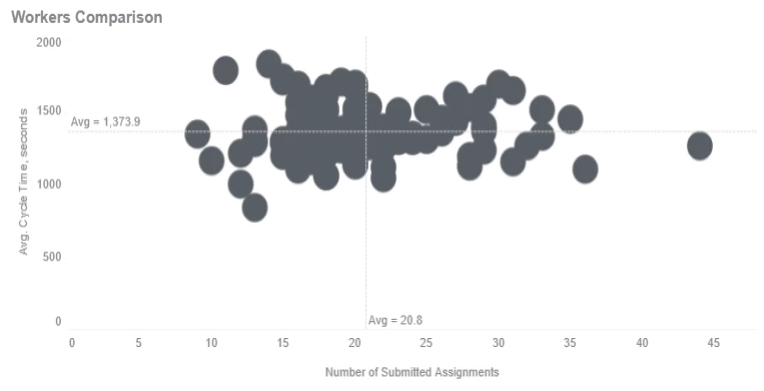
The Workers Comparison view allows you to compare workers by the average cycle time and the number of submitted assignments.
To compare workers to one another, average baselines are calculated as the average of averages. Each circle represents a single worker and includes the average cycle time and the total number of submitted assignments associated with the worker.
Worker Details
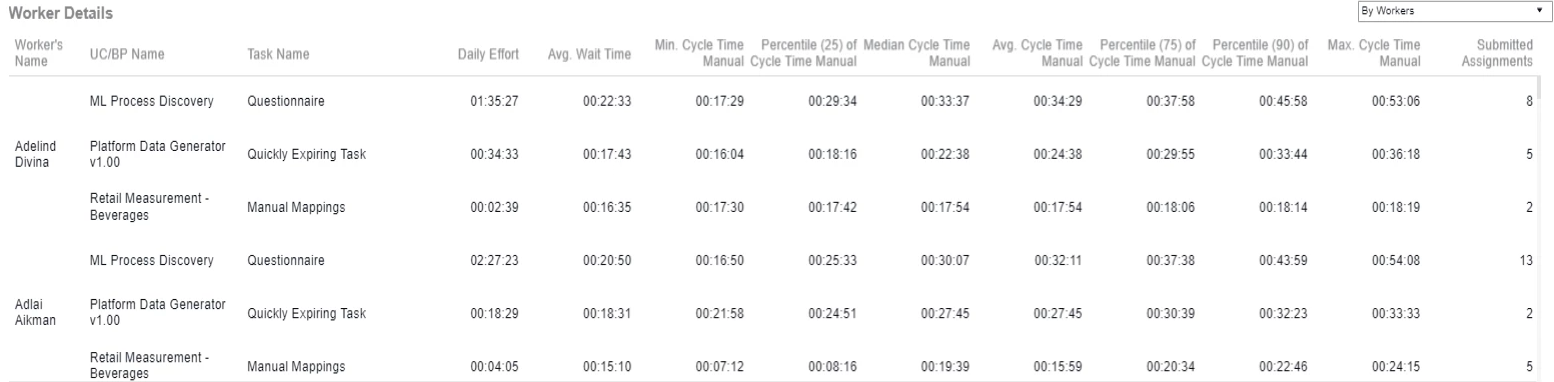
Worker Details is a detailed tabular view to provide the particulars behind each task and worker with extended time statistics.
Grouping for this view is controlled by the drop-down selection allowing one to switch between the worker- and task-oriented perspectives:
The worker-oriented perspective lets you review individual worker performance and tasks they are handling.
The task-oriented one allows you to review and compare worker performance for a single task.
The table includes the following information per Worker Name, Business Process Name, and Task Name:
- Daily effort—average daily time spent by workers on specific tasks
- Average waiting time
- Minimum cycle time
- Percentile (25) of cycle time
- Median cycle time
- Average cycle time
- Percentile (75) of cycle time
- Percentile (90) of cycle time
- Maximum cycle time
- Completed Manual Tasks