
Process (legacy)
The Process dashboard provides an in-depth drill-down into process metrics.
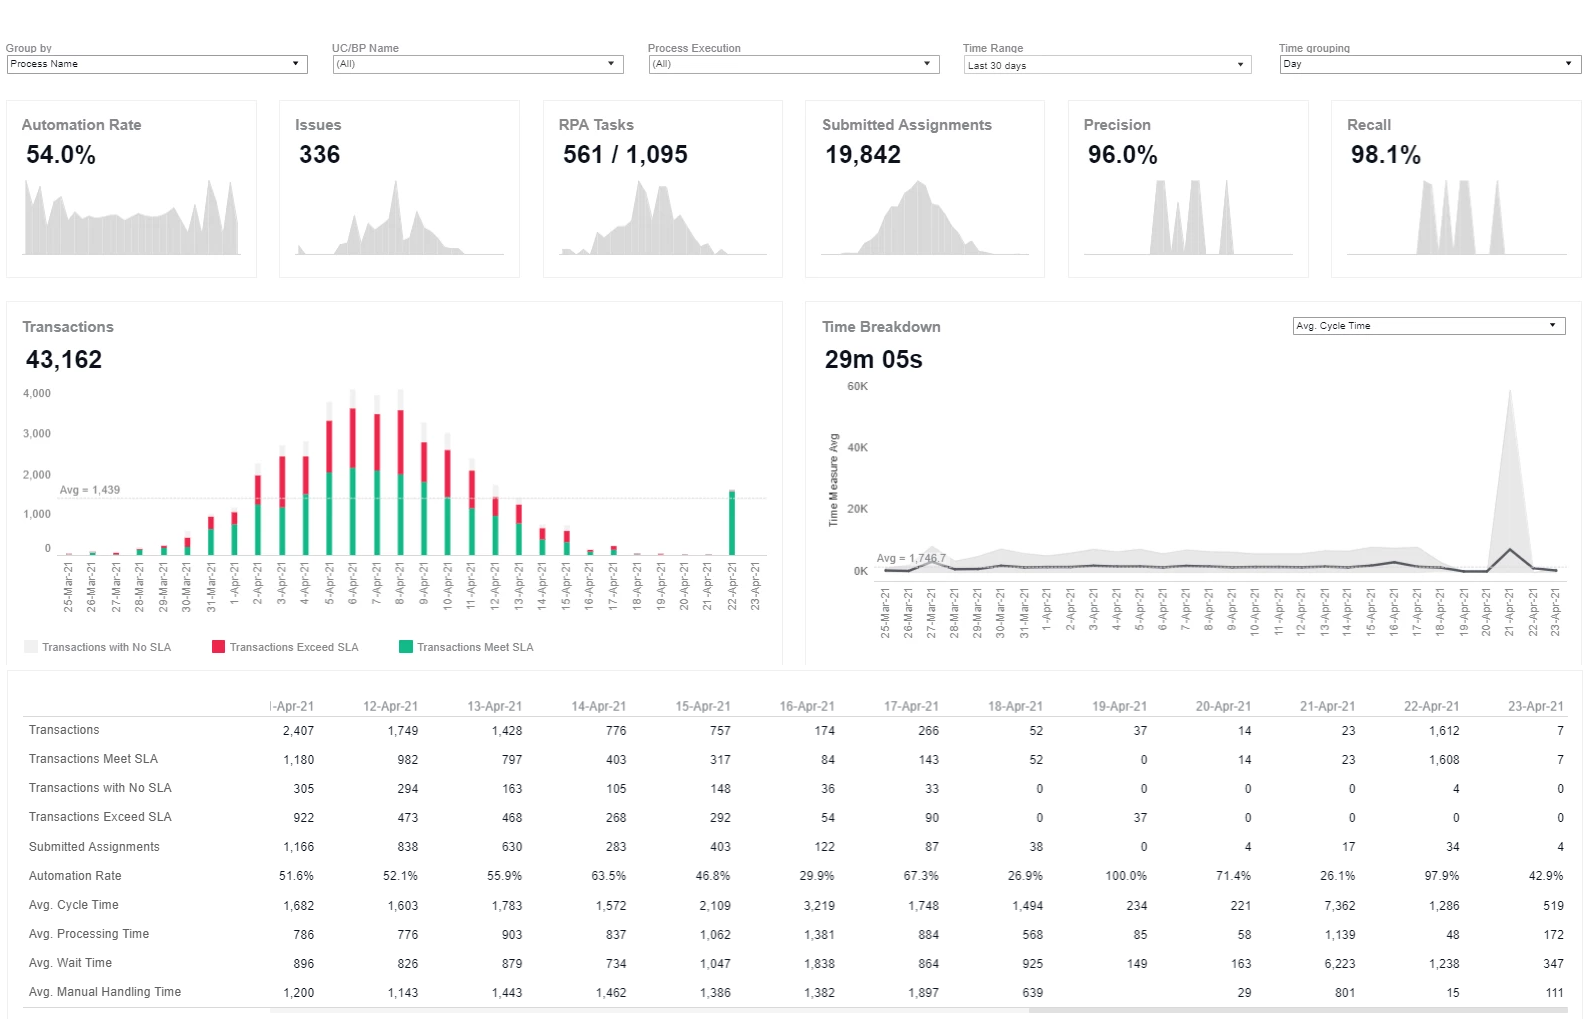
For detailed information, refer to the Views section.
When using the Process dashboard, pay attention to the following considerations:
For the dashboard, data selection is limited to 30 days of completed transactions. Regardless of the actually selected time range, the dashboard displays no transactions older than 30 days.
Mind that even if Business Processes are deleted from Control Tower, related transactions may still be processed by the Analytics engine and taken into account for calculations.
Manual Tasks are calculated separately on top of WorkSpace data, depending on the particular implementation and business context. In some cases, Manual Task volumes can exceed the total number of transactions, which additionally impacts the Automation Rate calculation resulting in lower values.
Time axes are linked as follows:
For Automation Rate, Manual Tasks, Volume, and Time Breakdown, the date and time are derived from the transaction end date.
For Precision, Recall, Issues, RPA Tasks, the date and time are derived from the process execution start date.
Filtering
The Process dashboard features the following filtering options:
- Group by lets you specify whether the dashboard data is presented by individual Business Processes (default option) or by Use Cases.
- Name limits the view to specific Business Processes or Use Cases, depending on the Group by selection.
- Time Range limits the display of process execution data to a specific period.
- Time Grouping allows specifying the date granularity and visual representation by choosing from the following options: Hour, Day, Week, Month, or Quarter. As a result, all time-based views present data in a selected way—by hours, days, and so on.
Views
Key Performance Indicators

The view contains the following data points, each supported by a daily trend visualization:
- Average automation rate
- Total technical issues during executions
- Total number of RPA tasks
- Total number of submitted Manual Tasks
- Average precision
- Average recall
Volume
The Volume view features time-based metrics and trends on processing volumes—the number of transactions processed in a unit of time, such as hour, day, week, month, quarter. Additionally, it breaks down transactions by the following categories:
- No SLA (Service Level Agreement)
- Meet SLA
- Exceed SLA
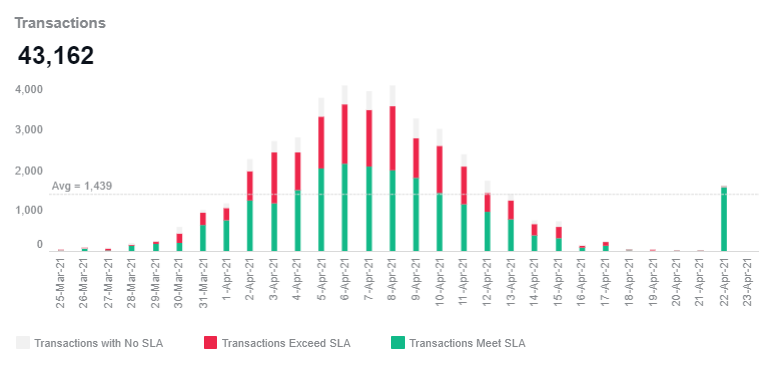
The chart is supported by an average baseline, which makes it possible to quickly identify major processing volume outliers and total completed transactions within a selected scope.
Time Breakdown
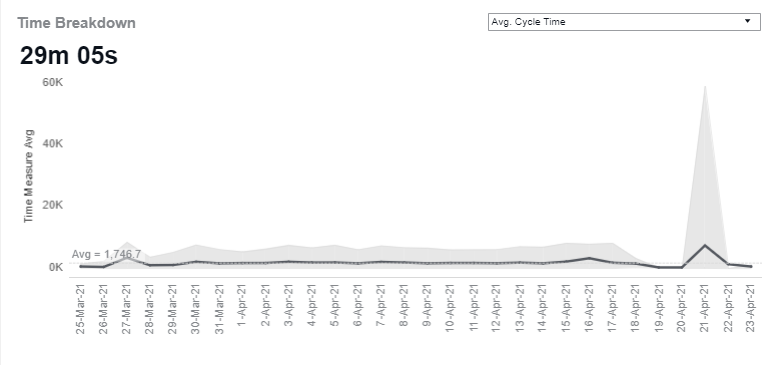
The Time Breakdown view allows evaluating the average processing time for one or more selected processes grouped based on the Time Grouping filter. The filter's drop-down selection lets you define the data display criterion:
- Cycle Time
- Processing Time
- Wait Time
- Manual Time
Tabular
The tabular view represents the same data as in the dashboard visualizations. It serves as a reference to indicate specific values and facilitate the value-to-value direct comparison of metrics.
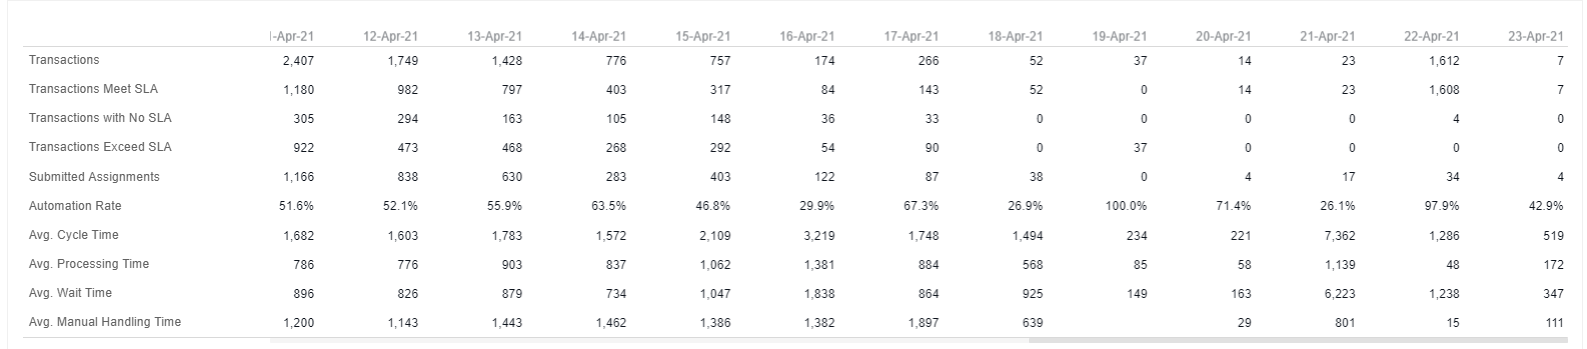
The view contains the following metrics broken down by a selected time unit—hour, day, week, month, or quarter:
- Volume of completed transactions
- Volume of transactions meeting the SLA criteria
- Volume of transactions having no SLA settings
- Volume of transactions exceeding the SLA criteria
- Volume of submitted Manual Tasks
- Automation rate
- Average cycle time
- Average wait time
- Average manual handling time