
Overview dashboard
The Overview dashboard provides a high-level summary of daily operations and overall automation health. From it, you can access the following data:
- Number of currently active Business Processes and Use Cases
- Key throughput metrics
- Technical issues
- Processing timing
- Manual work volumes
For detailed information on available data, refer to the Views section.
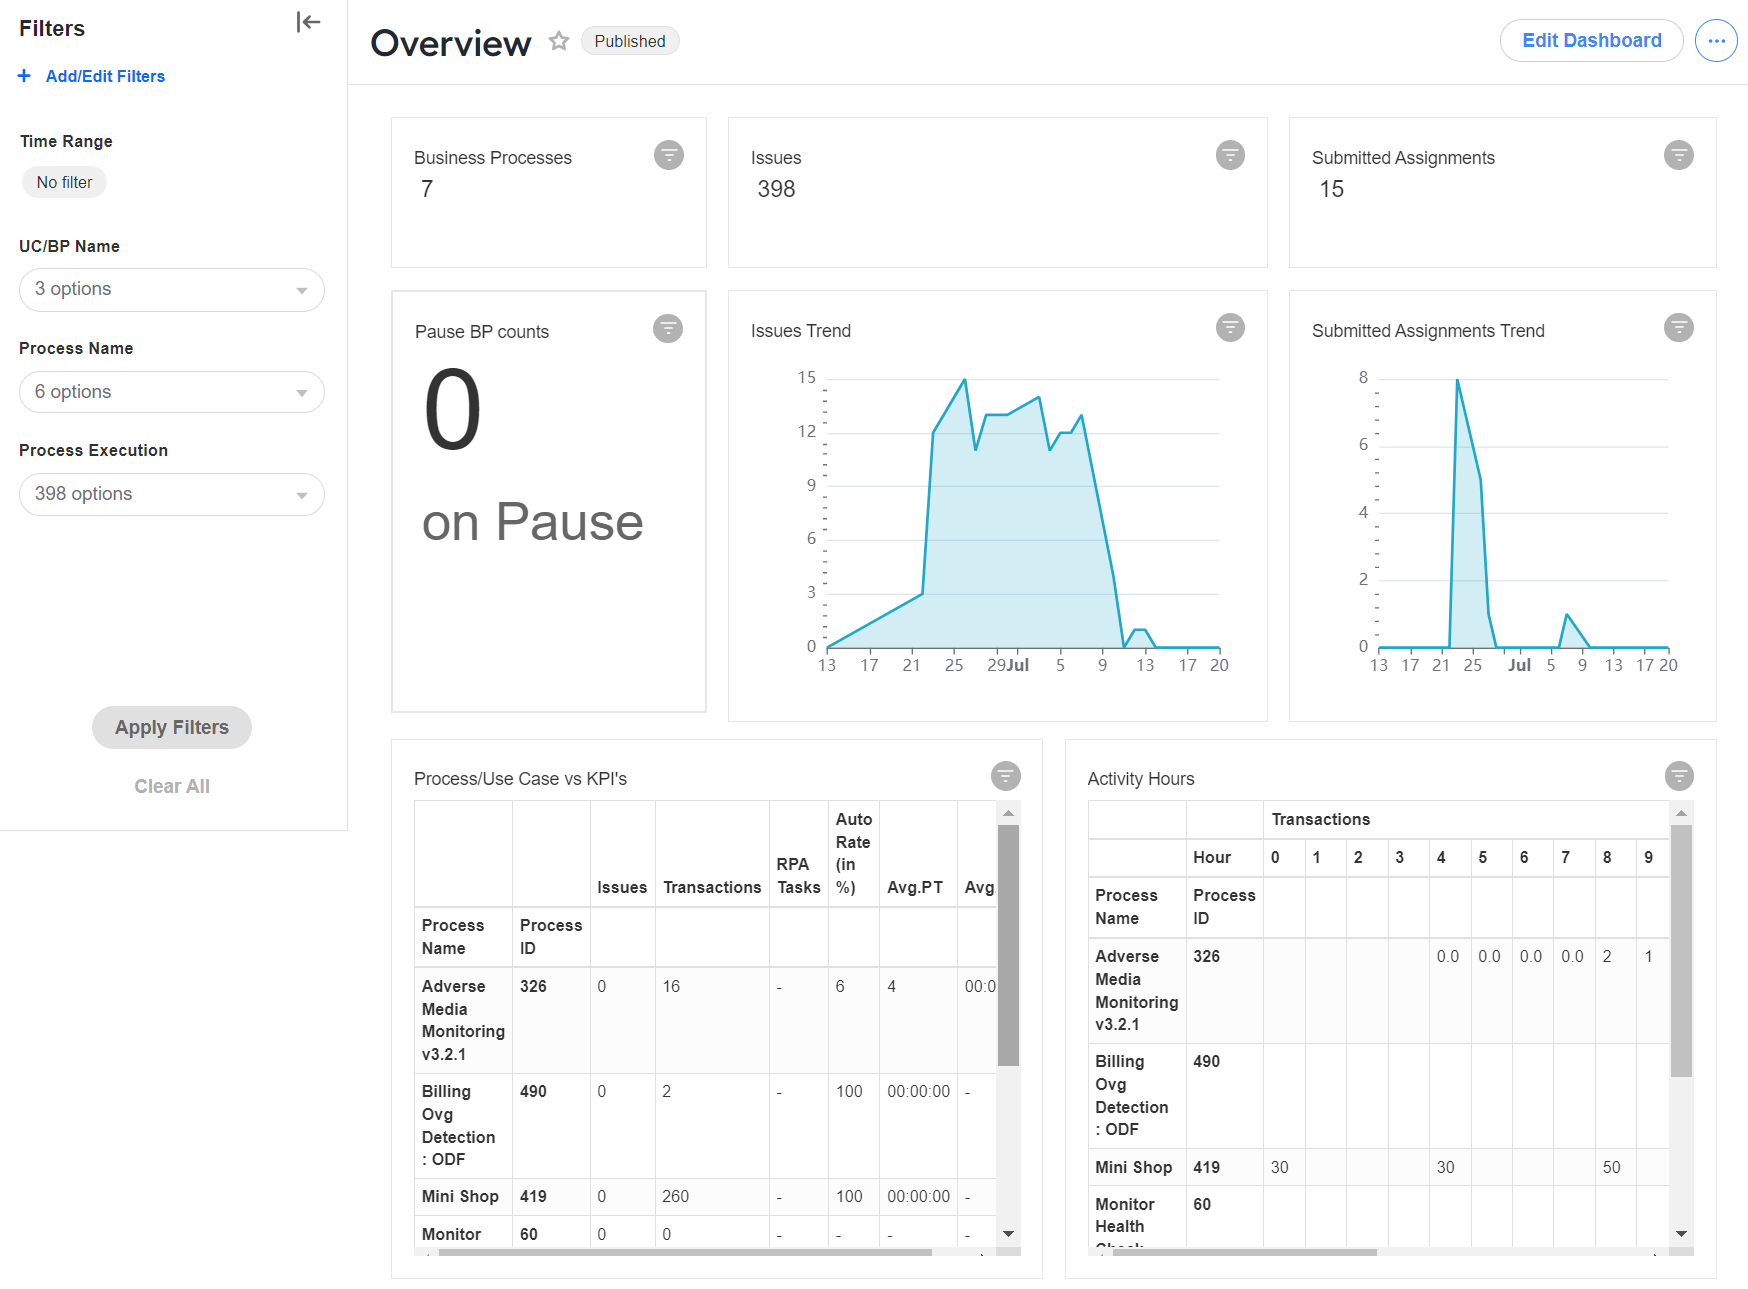
When using the Overview dashboard, pay attention to the following considerations:
For the dashboard, data selection is limited to 30 days of completed transactions. Regardless of the actually selected time range, the dashboard displays transactions not older than 30 days.
Mind that even if Business Processes are deleted from Control Tower, related transactions may still be processed by the Analytics engine and taken into account for calculations.
Manual Tasks are calculated separately on top of WorkSpace data, depending on the particular implementation and business context. In some cases, Manual Task volumes can exceed the total number of transactions, which additionally impacts the Automation Rate calculation resulting in lower values.
All time axes are derived from process execution start dates. For accurate evaluations, review processes running 24/7 or long-running transactions and executions separately.
Views
Key Performance Indicators
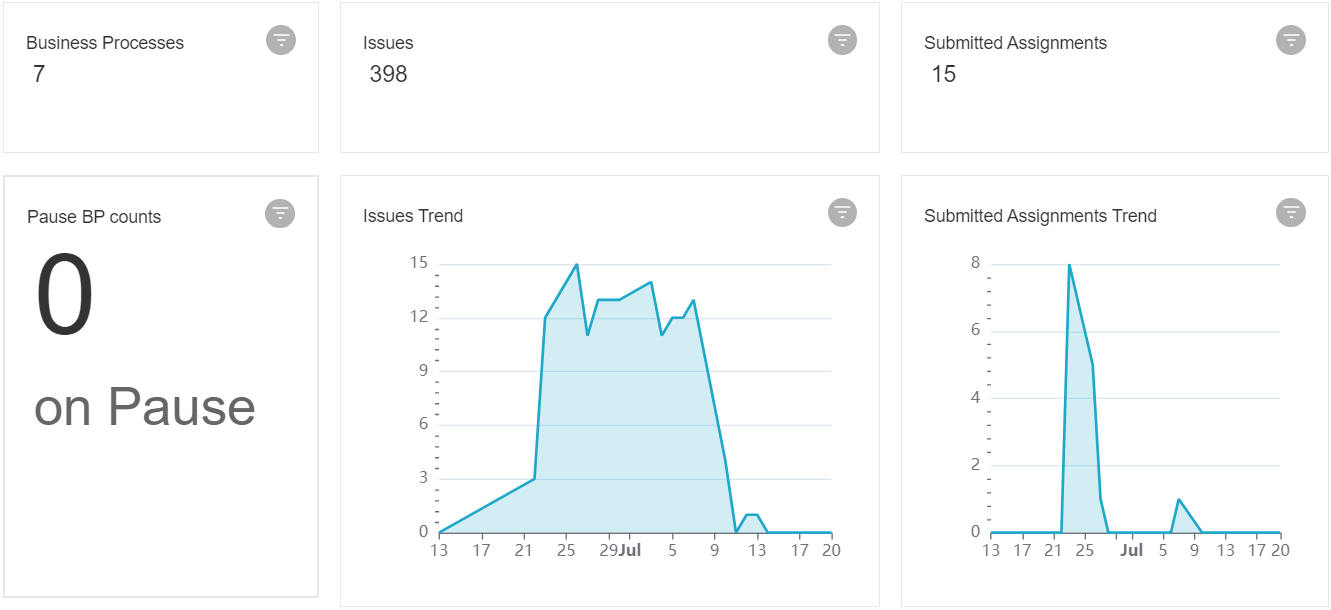
The Key Performance Indicators (KPI) view displays the following information:
- Total number of executed Business Processes
- Total number of Business Processes that are on pause and currently not active
- Total number of technical issues during executions, supported by a daily trend visualization
- Total number of submitted Manual Tasks in WorkSpace, supported by a daily trend visualization
Process
The Process view extends the KPI one, providing a by-process breakdown and key performance metrics.
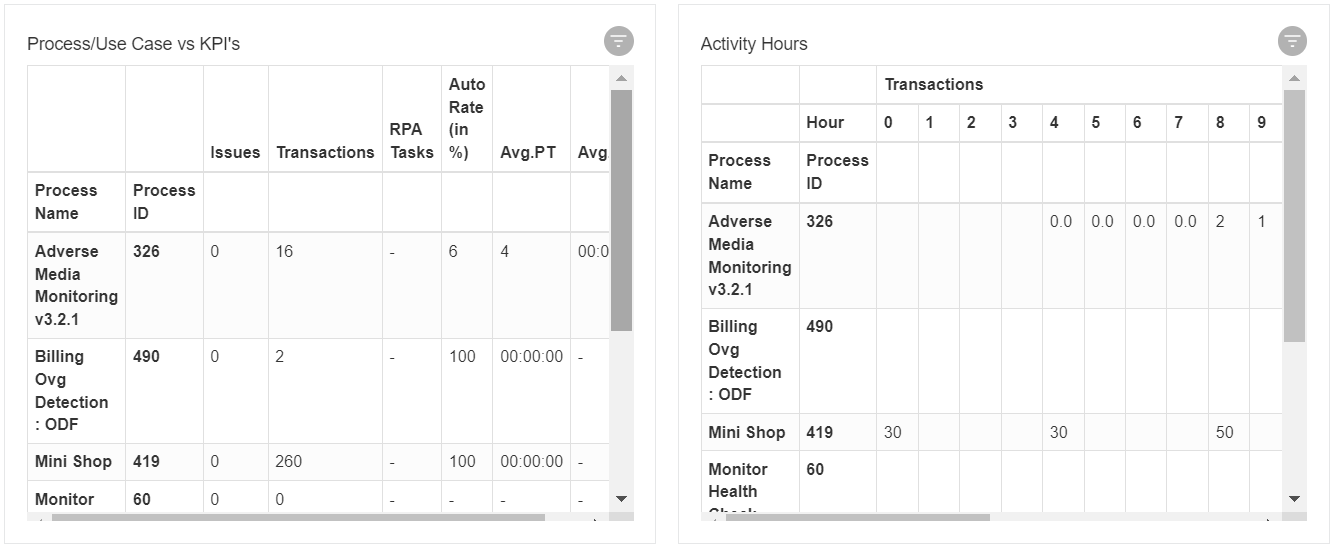
The view includes the following data points:
- Process Name: Business Process name.
- Process ID: unique identifier of the Business Process.
- Issues: total technical issues during process executions.
- Transactions: total transactions completed over a selected period.
- RPA Tasks: an RPA health metric indicating the number of successful tasks relative to total executed tasks. For example, the 9/29 value means there were 29 tasks in total, and only nine of them were completed successfully.
- Auto Rate: fully automated portion of work requiring no further manual reviews or actions by a human operator.
- Avg. PT: the average time required to process a single transaction during an execution.
- Avg. MHT: the average time required to process a Manual Task in WorkSpace. The value only accounts for actual human work and is calculated based on accept and submit timestamps.
- Activity Hours: a table representing the number of transactions processed per hour of the day. It lets you evaluate hourly workload and process scheduling for efficient resource planning and overall optimization.
Filters
On the Filters panel for the out-of-the-box Overview dashboard, the following default filtering options are available:
For instructions to create, set, edit, and apply filters, refer to Superset Analytics overview | Filter dashboard data.