Issues related to customer-side problems
For instance, a customer-side problem can be a bad network connection. To investigate, act as follows:
Check with browser tools
In the Chrome browser, navigate to Options and click More tools.

Click Developer tools or simply start it with Ctrl + Shift + I. After the Developer tools load, you should see something like this:
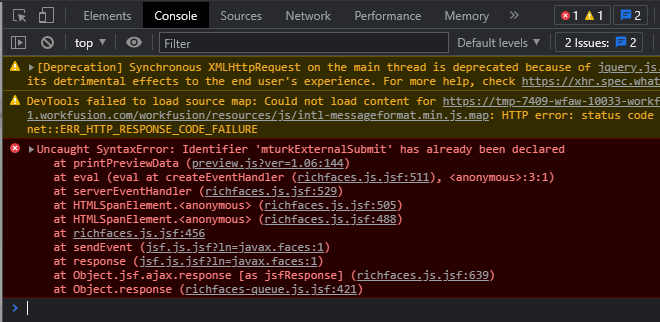
In the Console tab, you can see exceptions in red and warnings in yellow. Anything preventing the page from correct loading pops up with a log here.
If you found nothing suspicious, go to the Network tab to check the response time and detect slow requests (if any).
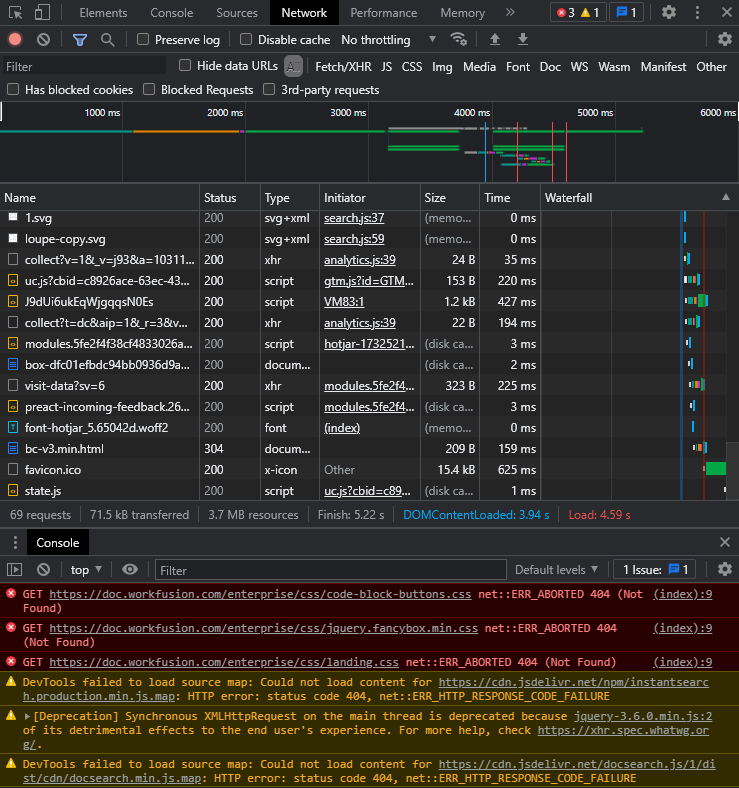
Network inspector is a powerful tool to inspect the page background behavior, elements causing slowdowns, and root causes for network issues.
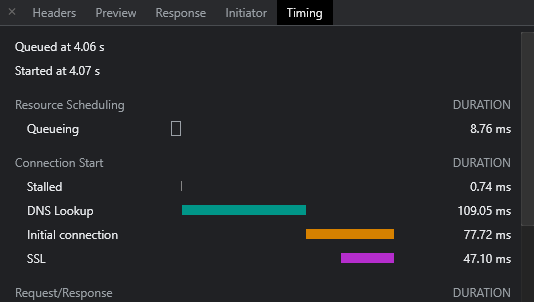
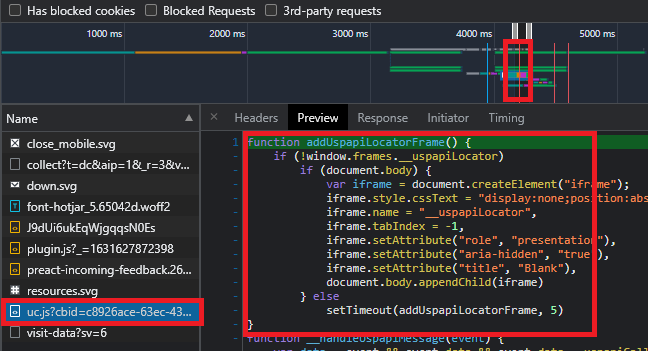
In the Timing tab, inspect the request and response time, DNS lookup time, SSL protocol, and other operation duration values for any elements. This can be especially useful if you think the issue is connected to network security, slow connection, or anything that doesn't give explicit exceptions or explanations of root causes for slowdowns.
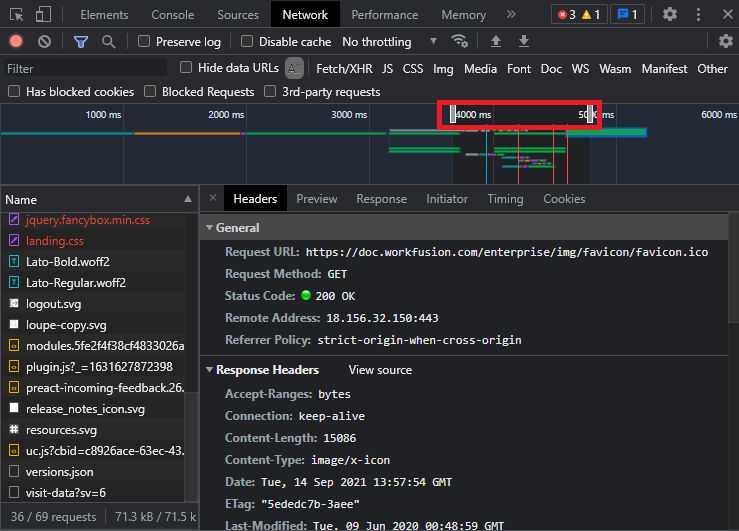
On the left-hand side panel, set the time rulers and review the elements you think load longer than they should. If you suspect a customization issue, inspect the JavaScript code to find out whether the long processing time is due to the code-related issues.
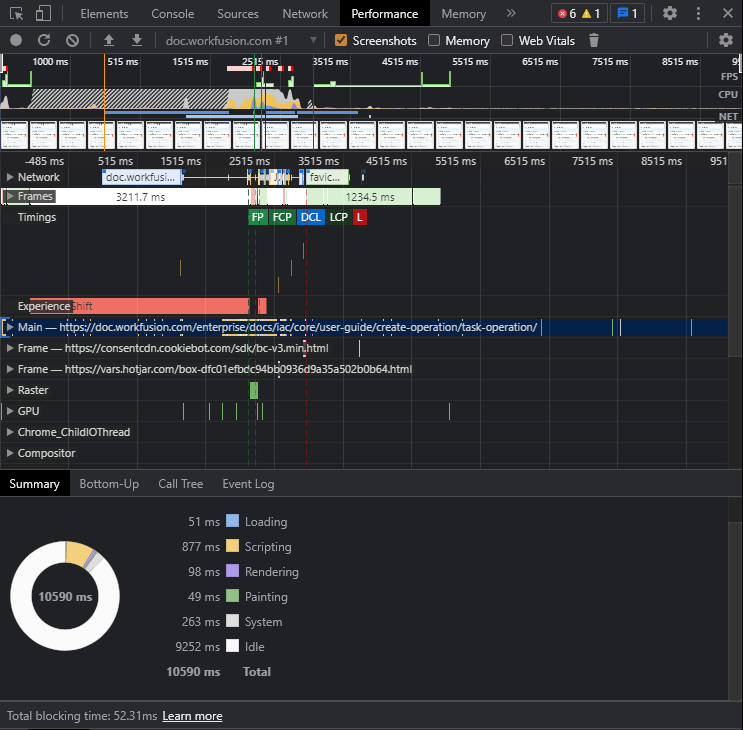
The Performance tab can be helpful in getting a big picture of what is causing the longest response time and taking the most significant chunk of the processing time. After an action is recorded, the tool prompts the slowdown issue, which can be a quick win for your investigation.
Compare loading time on different machines
Make sure the loading time is the same on different machines. If it is different, check browser configurations on the client machine. Go to Chrome menu, select More tools, and click Extensions.
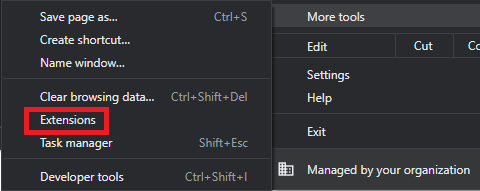
There can be an installed extension or a plugin blocking pages from loading or slowing down the connection in the same manner as AdBlock blocks popup ads. In this case, you may want to disable it temporarily to compare performance with and without it.
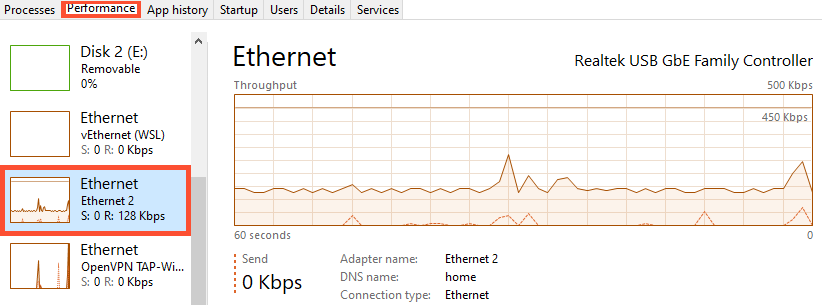
If you want to observe the overall network workload during an action in progress, use Windows Tasks Manager:
Run Windows Tasks Manager.
Click the Performance tab.
Select the network you want to inspect.
Output
If you confirm any of the issues, take appropriate measures to eliminate them. If the issue is related to such customer-side problems as JS code, escalate it to the Support team. Otherwise, continue the investigation.
View also: