Issues related to database performance
High load on the MS SQL side and issues, such as slow queries or deadlocks, can cause Manual Tasks to perform slowly.
To investigate whether you are dealing with database issues, follow the steps below.
Analyze thread dumps and deadlocks
Take a few thread dumps on the Control Tower (CT) and Workspace (WS) sides to check for threads stuck in the response from the database. For instructions on getting and analyzing thread dumps, refer to the Analyze Thread Dump article.
Analyze deadlocks.
Run health checks
Work with the Database Analyst (DBA) team and execute a standard set of health check queries. For instance, to check for deadlocks or component fallbacks, you can use the queries below:
Deadlock statistics
select
      d.name as DatabaseName
    , convert
        ( bigint
        , ( ( 1.0 * p.cntr_value
            / nullif( datediff( DD, d.create_date, current_timestamp), 0)
            )
          )
        ) as AverageDeadlockPerDay
    , p.cntr_value      as DeadlocksSinceStartup
    , d.create_date     as StartupDateTime
from sys.dm_os_performance_counters as p
join sys.databases                  as d on d.name = 'workfusion'
where   rtrim( p.counter_name ) = 'Number of Deadlocks/sec'
    and rtrim( p.instance_name) = '_Total'
Table sizes
select
      s.name                                                                    as SchemaName
    , t.name                                                                    as TableName
    , p.rows                                                                    as rows
    , sum(a.total_pages) * 8                                                    as TotalSpace_KB
    , cast(round(((sum(a.total_pages) * 8) / 1024.00), 2) AS numeric(36, 2))    as TotalSpace_MB
    , sum(a.used_pages) * 8                                                     as UsedSpace_KB
    , cast(round(((sum(a.used_pages) * 8) / 1024.00), 2) AS numeric(36, 2))     as UsedSpace_MB
    , (sum(a.total_pages) - sum(a.used_pages)) * 8                              as UnusedSpace_KB
    , cast(round(((sum(a.total_pages) - sum(a.used_pages)) * 8) / 1024.00, 2) as numeric(36, 2)) as UnusedSpace_MB
from sys.tables             t with (nolock)
join sys.indexes            i with (nolock) on t.OBJECT_ID = i.object_id
join sys.partitions         p with (nolock) on i.object_id = p.object_id and i.index_id = p.index_id
join sys.allocation_units   a with (nolock) on p.partition_id = a.container_id
left join sys.schemas       s with (nolock) on t.schema_id = s.schema_id
where t.is_ms_shipped = 0
group by t.Name, s.Name, p.Rows
order by TotalSpace_MB desc --, t.Name
Top CPU queries
declare @sql_fragment nvarchar(4000) = '';  --Specify any fragment from the problematic query to limit the list or leave it empty to show all
declare @duration_gt_sec int = 0;           --Look for queries with avg duration > then this value
select top 25
      d.name as db_name
    , substring(t.text
                , (s.statement_start_offset / 2) + 1
                , ((case s.statement_end_offset
                        when -1 then datalength(t.text)
                        else s.statement_end_offset
                    end - s.statement_start_offset) / 2) + 1
                 )                  as statement_text
    , s.creation_time
    , s.last_execution_time
    , s.execution_count
    , s.total_worker_time / 1000 as total_cpu_time_ms
    , s.total_elapsed_time / 1000 as total_elapsed_time_ms
    , s.total_elapsed_time / 1000 / s.execution_count as avg_elapsed_time_ms
    , case when s.execution_count > 1
            then s.total_worker_time / nullif(datediff(ms, s.creation_time, s.last_execution_time), 0) / 10.0
            else null
      end as total_cpu_percent
    , s.total_logical_reads
    , s.total_physical_reads
    , s.total_logical_writes
    , s.max_used_threads
    , s.max_dop
    , s.plan_handle
    , p.query_plan
from sys.dm_exec_query_stats s
cross apply sys.dm_exec_sql_text(s.plan_handle) t
outer apply sys.dm_exec_query_plan(s.plan_handle) p
inner join sys.databases d on t.dbid = d.database_id
where (@sql_fragment = '' or t.text like '%' + @sql_fragment + '%')
 and s.total_elapsed_time / 1000 / s.execution_count > @duration_gt_sec * 1000 --Look for queries with avg duration > @duration_gt_sec
order by s.total_worker_time desc;
Currently running queries
select db_name(req.database_id) as db_name
     , substring(st.text
                , (req.statement_start_offset / 2) + 1
                , ((case statement_end_offset
                        when -1 then datalength(st.text)
                        else req.statement_end_offset
                    end - req.statement_start_offset) / 2) + 1
                 )                  as statement_text
     , req.session_id
     , req.blocking_session_id
     , req.wait_type
     , req.wait_time
     , req.wait_resource
     , req.status
     , req.command
     , req.cpu_time                 as cpu_time_ms
     , req.total_elapsed_time       as total_time_ms
     , req.percent_complete
     , qp.query_plan
from sys.dm_exec_requests                           req
outer apply sys.dm_exec_query_plan(req.plan_handle) qp
cross apply sys.dm_exec_sql_text(sql_handle)        st;
Check data purging issues
Check if the issue is related to a running data purging query under one of the following scenarios:
Manual purge.
Scheduled runs at high-load business hours.
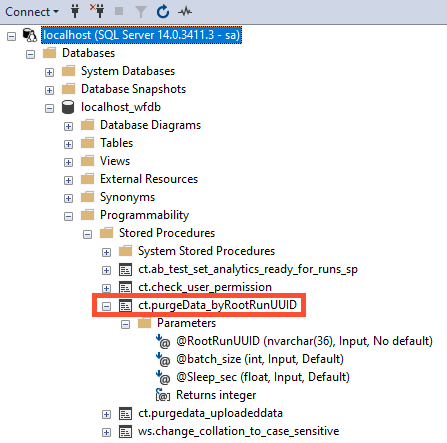
Running a database data management configuration based on a stored procedure. When a purge is triggered by a stored procedure, you can usually stop it by temporarily renaming the purgeData_byRootRunUUID stored procedure:
Check the MS SQL server disk has sufficient space.
Output
If you confirm the issue, escalate it to DBAs. Otherwise, continue the investigation.
View also: