Issues related to changes in input data
The article describes issues related to the volume or structure of input data that can be causing BP performance degradation at Manual Task steps.
Increased data volume
A Business Process (BP) Service-Level Agreement (SLA) can be broken, or Workspace (WS) performance can be slow due to multiple processed tasks.
To investigate, act as follows:
- For Work.AI versions up to 10.2.9
- For Work.AI v10.3+
Check waiting assignments
Check the total number of tasks waiting unanswered. Go to WS and count the tasks in the Assignments list:
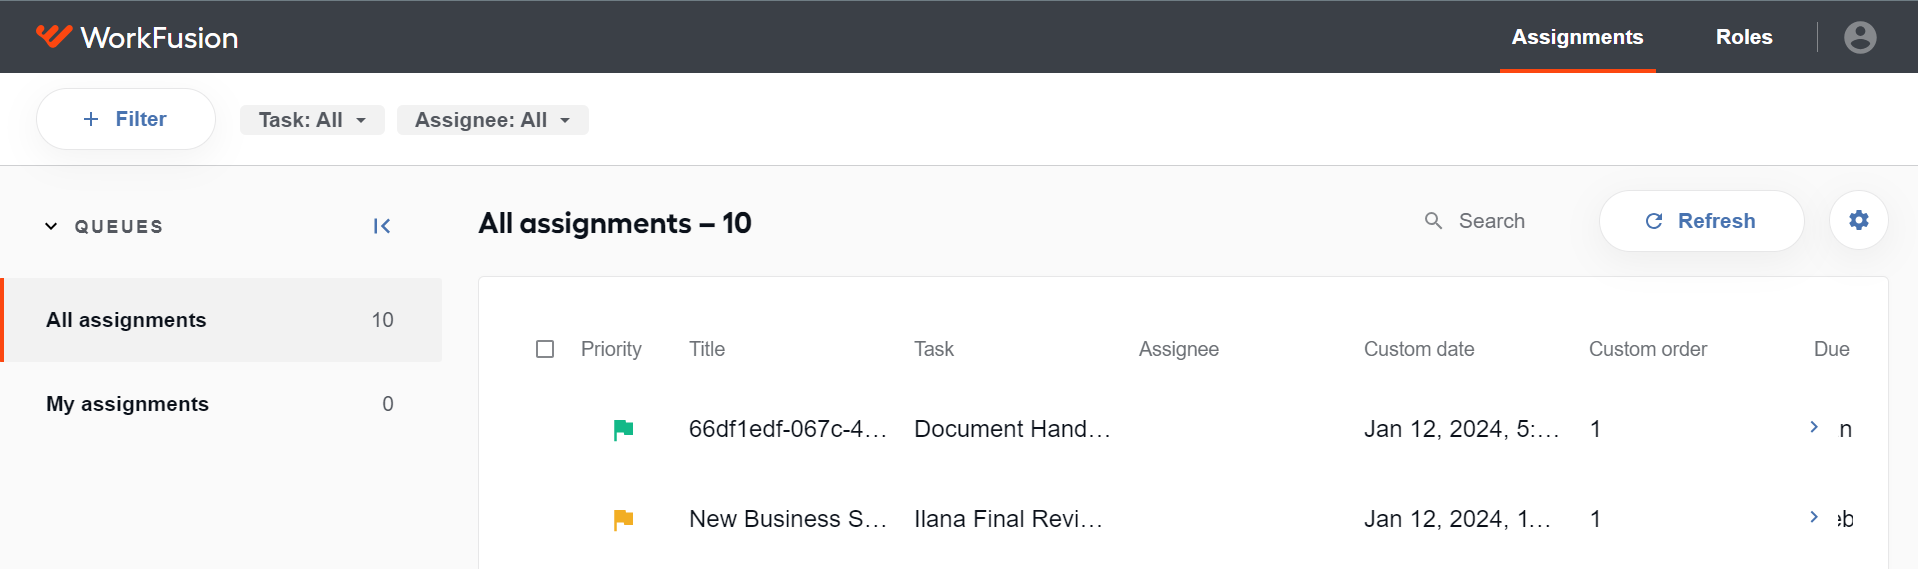
When the number of tasks is high, act as follows:
- Work with the business (SMEs, end users) to justify the high number of tasks affecting the WS performance.
- Check if Control Tower contains unanswered tasks due to pausing, omission, a business mistake, or a bug.
To check whether the data volume has increased on a specific task, go to the Control Tower user interface and compare the number of input documents for a Manual Task with good and poor performance values.
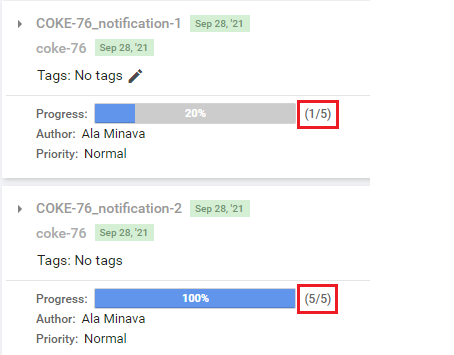
Alternatively, you can submit an SQL query to ct.hitsubmissiondataitem/Analytics:

If you prefer to review data from the respective BP directly in the database, find tasks by hit id and review the jsondataitemvalues column. This shows all data from a specific Manual Task in WS and potential anomalies.
Check waiting assignments
Check the total number of tasks waiting unanswered. Go to WS and count the tasks in the Assignments list:
When the number of tasks is high, act as follows:
- Work with the business (SMEs, end users) to justify the high number of tasks affecting the WS performance.
- Check if Control Tower contains unanswered tasks due to pausing, omission, a business mistake, or a bug.
If you prefer to review data from the respective BP directly in the database, find tasks by hit id and review the jsondataitemvalues column. This shows all data from a specific Manual Task in WS and potential anomalies.
Test performance
If you confirm the data volume has increased unexpectedly and radically, launch the task with the previous data volume and measure its performance.
Check load tests
If you confirm the data volume is the root cause, check if load tests covered the same data volume.
Output
Escalate the issues to the Support team. Otherwise, continue the investigation.
New document introduced for processing
A new document loads slowly in Workspace (WS) before a task is accepted. To confirm the hypothesis about the root cause, open the Chrome browser and go to Developer Tools or press Ctrl + Shift + I. In the inspector, select the Console tab:

Make sure the issue is not related to a temporary network problem or downtime:

The Manual Task template code can include customizations, for instance, JavaScript code fetching additional data, which makes the data load slowly, though the task in WS works flawlessly. Slowdowns can also occur due to a more complicated task structure (for instance, multiple tables or pages) or broken structure (for instance, empty table rows).
If you suspect the issue is related to the new document or slow loading of the input data from the document, act as follows:
Check source document location
Check the accessibility of the source document location. When you identify the connection as the bottleneck and you deal with increased document size, unstructured documents, or scanned images, check the connection to S3 or another preferred cloud or other storage. The connection should not be degraded or subject to new requirements. Try to access the document outside WS, for instance, in a browser, and evaluate the results.
When a slowdown happens upon loading from the source location, and it seems fishy, work with the DevOps team to determine whether you can make any adjustments. Security, size limit, exceeded byte limit, connection timeout, or connection pool settings may work better in the future.
Check document structure
Check whether the document structure is different or corrupted. When you identify a corrupted or massive data structure, go to the Machine Learning use case and review the Post Processing Bot Task customization:

If you know the BP rendering the Manual Task, go to the OCR or ML extraction step and download the tagged or raw XML or HTML, if available. Go to the Results tab, expand the Data section, and look for the document_ variables, for instance, document_xml_link_tagged or document_html_link_tagged.
If the customization seems to be an issue, try finding the bug.
When you find the problematic document, compare its size and structure to a similar one that loads without problems. Find out the difference, for instance:
- A radically increased number of pages slowing down the loading
- Corrupted OCR quality or OCR data structure
- Tags that might have been extracted by error
- Numerous tables containing a large data volume
Sometimes, the document may have useless or resource-consuming data appended by mistake, for instance, a bug in the extraction post- or pre-processing. It may also happen that a batch of combined PDFs has been sent to OCR and the machine learning extraction module. Basically, every possibility is worth investing time to investigate.
Reproduce on another environment
Try reproducing the issue on a different environment (for example, dev or test) of the same configuration.
Check previous tests
Check whether testing covered the document type.
Output
Escalate the issues to the Support team. Otherwise, continue the investigation.
View also: