
Manual
The Manual dashboard features the statistics for human task processing within WorkFusion Intelligent Automation Cloud Enterprise. You can benefit from the data in one of the following ways:
Find the worker who executed tasks for a particular Business Process.
See the task volumes processed by a person over a definite period.
Check how many people took part in a specific Business Process or task.
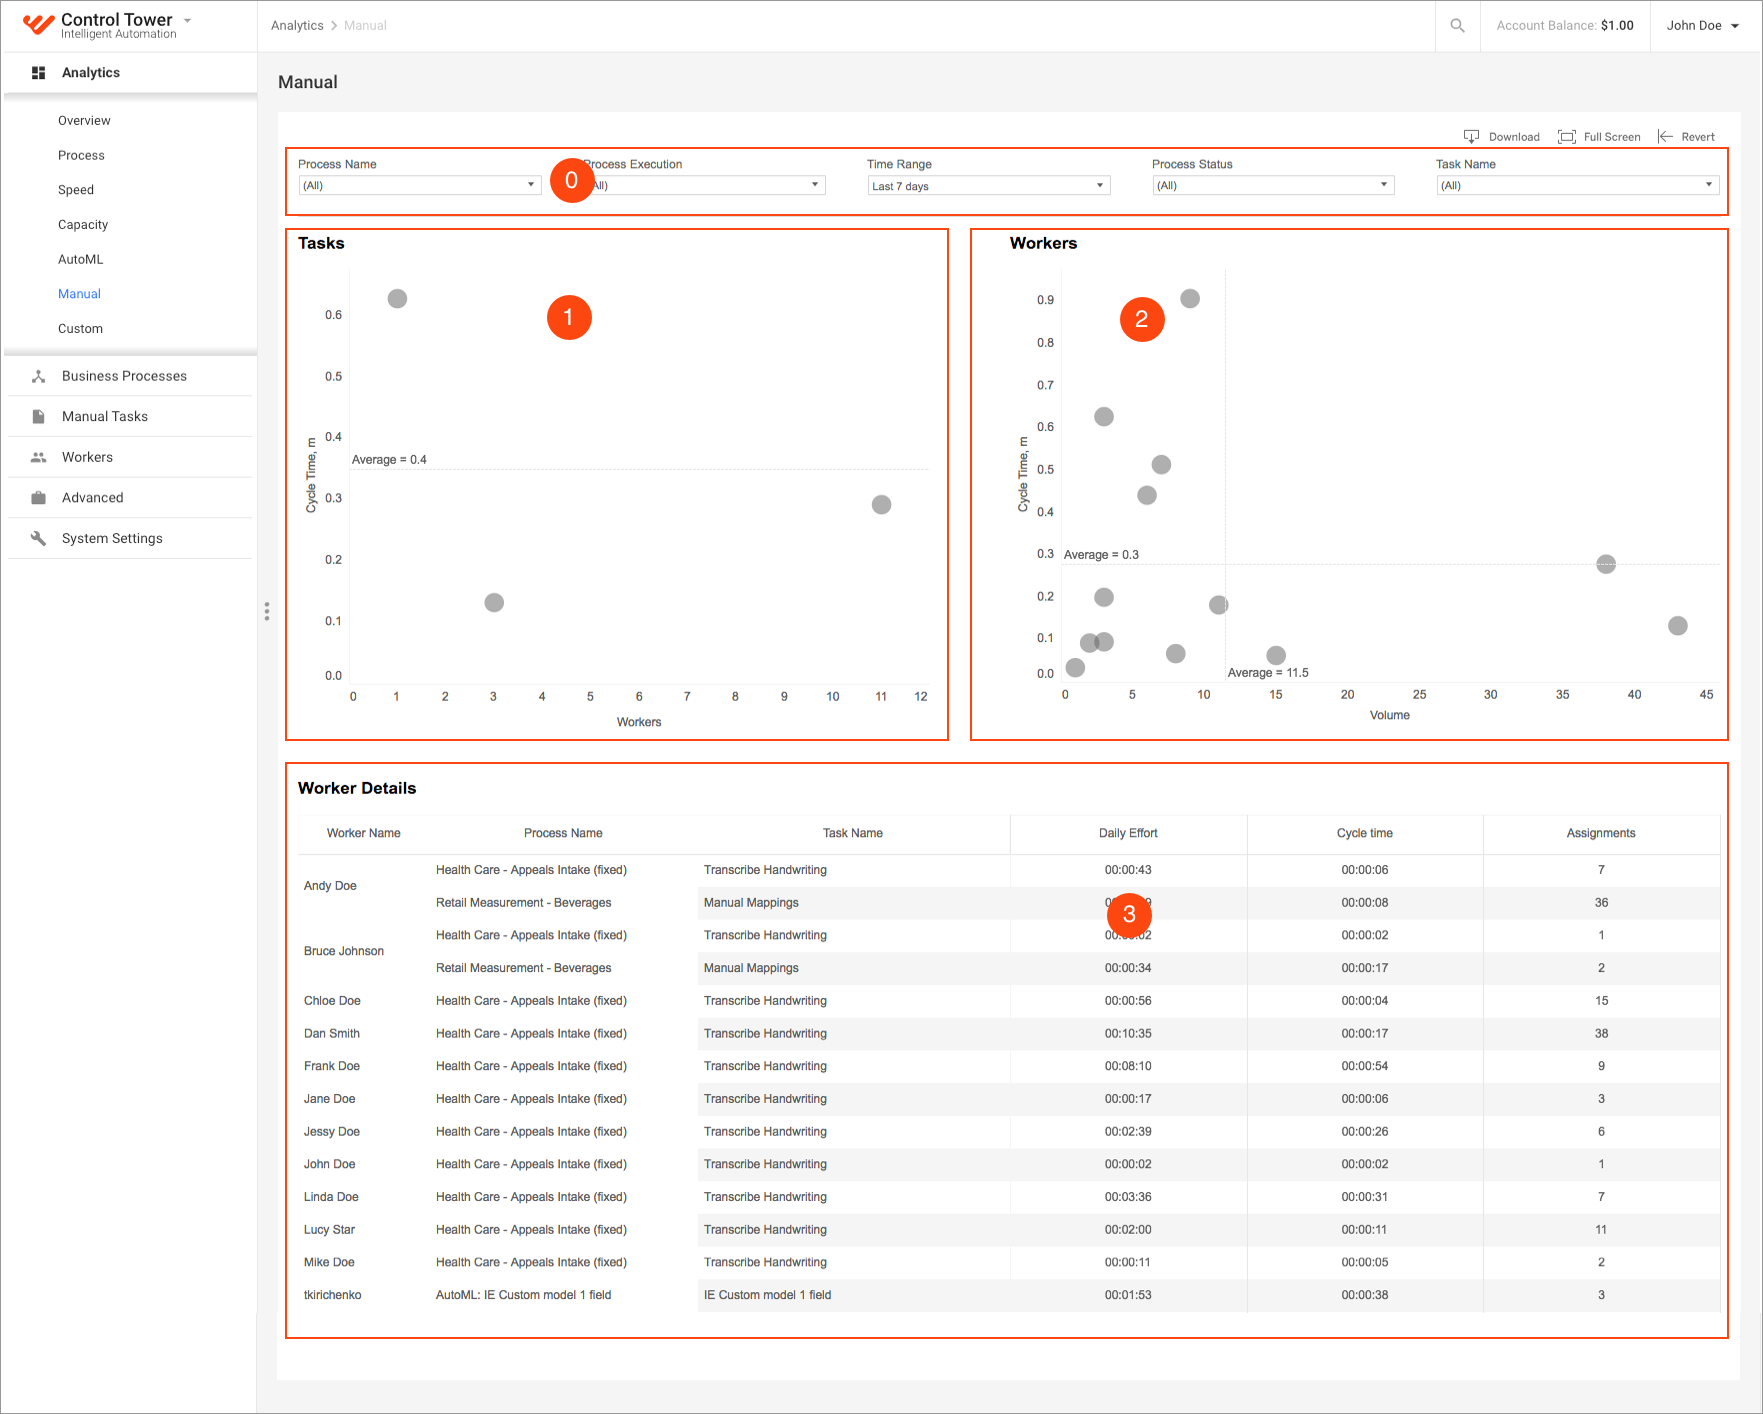
The dashboard features the following charts:
Tasks
Workers
Workers Details
Tasks
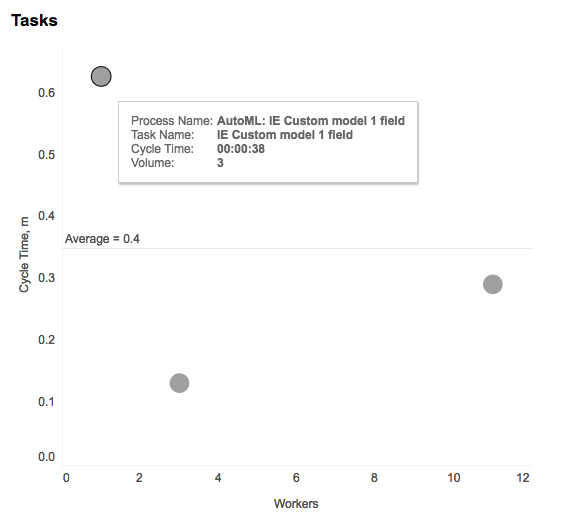
The scatter plot shows each task in two dimensions:
- X-axis: number of human workers who worked on the task
- Y-axis: average Cycle Time in minutes
Tooltip
The Tasks tooltip contains the following data:
- Process Name
- Task name
- Cycle Time in the hh:mm:ss format
- Volume
Workers
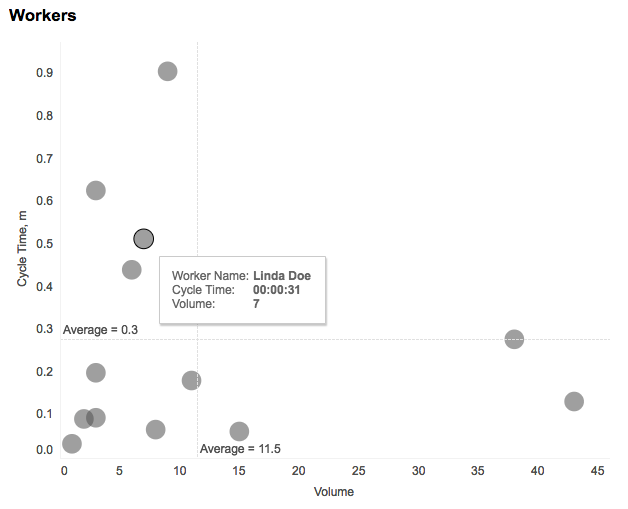
The scatter plot shows each worker in two dimensions:
- X-axis: number of tasks completed by the worker
- Y-axis: average Cycle Time in minutes
Tooltip
The Workers tooltip contains the following information:
- Worker Name
- Cycle Time in the hh:mm:ss format
- Volume
Workers Details
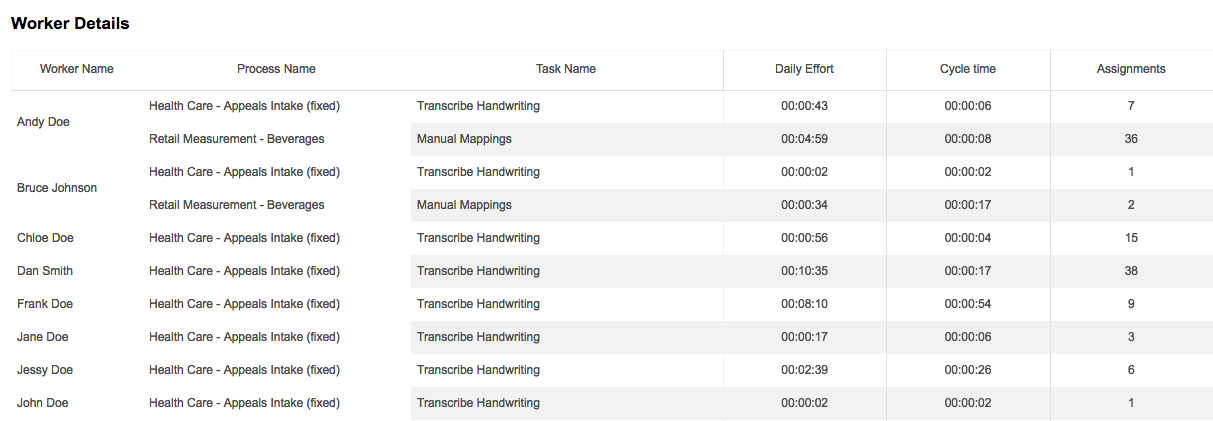
The table shows the following detailed information:
- Worker name
- Process name
- Task name
- Daily Effort
- Cycle time
- Assignments