
RPA
The RPA dashboard provides an overview of bot accuracy, performance, and utilization, gathering insights for bot process-level improvements.
The RPA dashboard features the following key metrics:
- Volume
- Bot availability
- RPA accuracy rate
- Tasks comparison
- Fleets utilization
- Bot Units workload
Volume
The chart displays the number of RPA sessions tracked for each day when process executions were started.
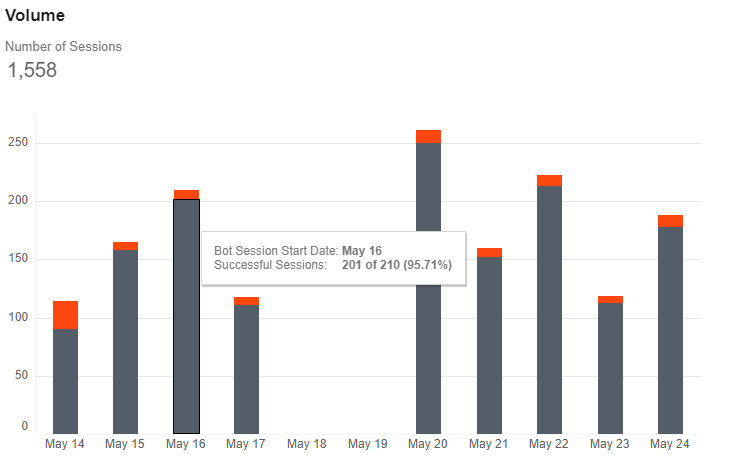
Successfully completed sessions are highlighted in gray, failed sessions—in red.
Bot Availability
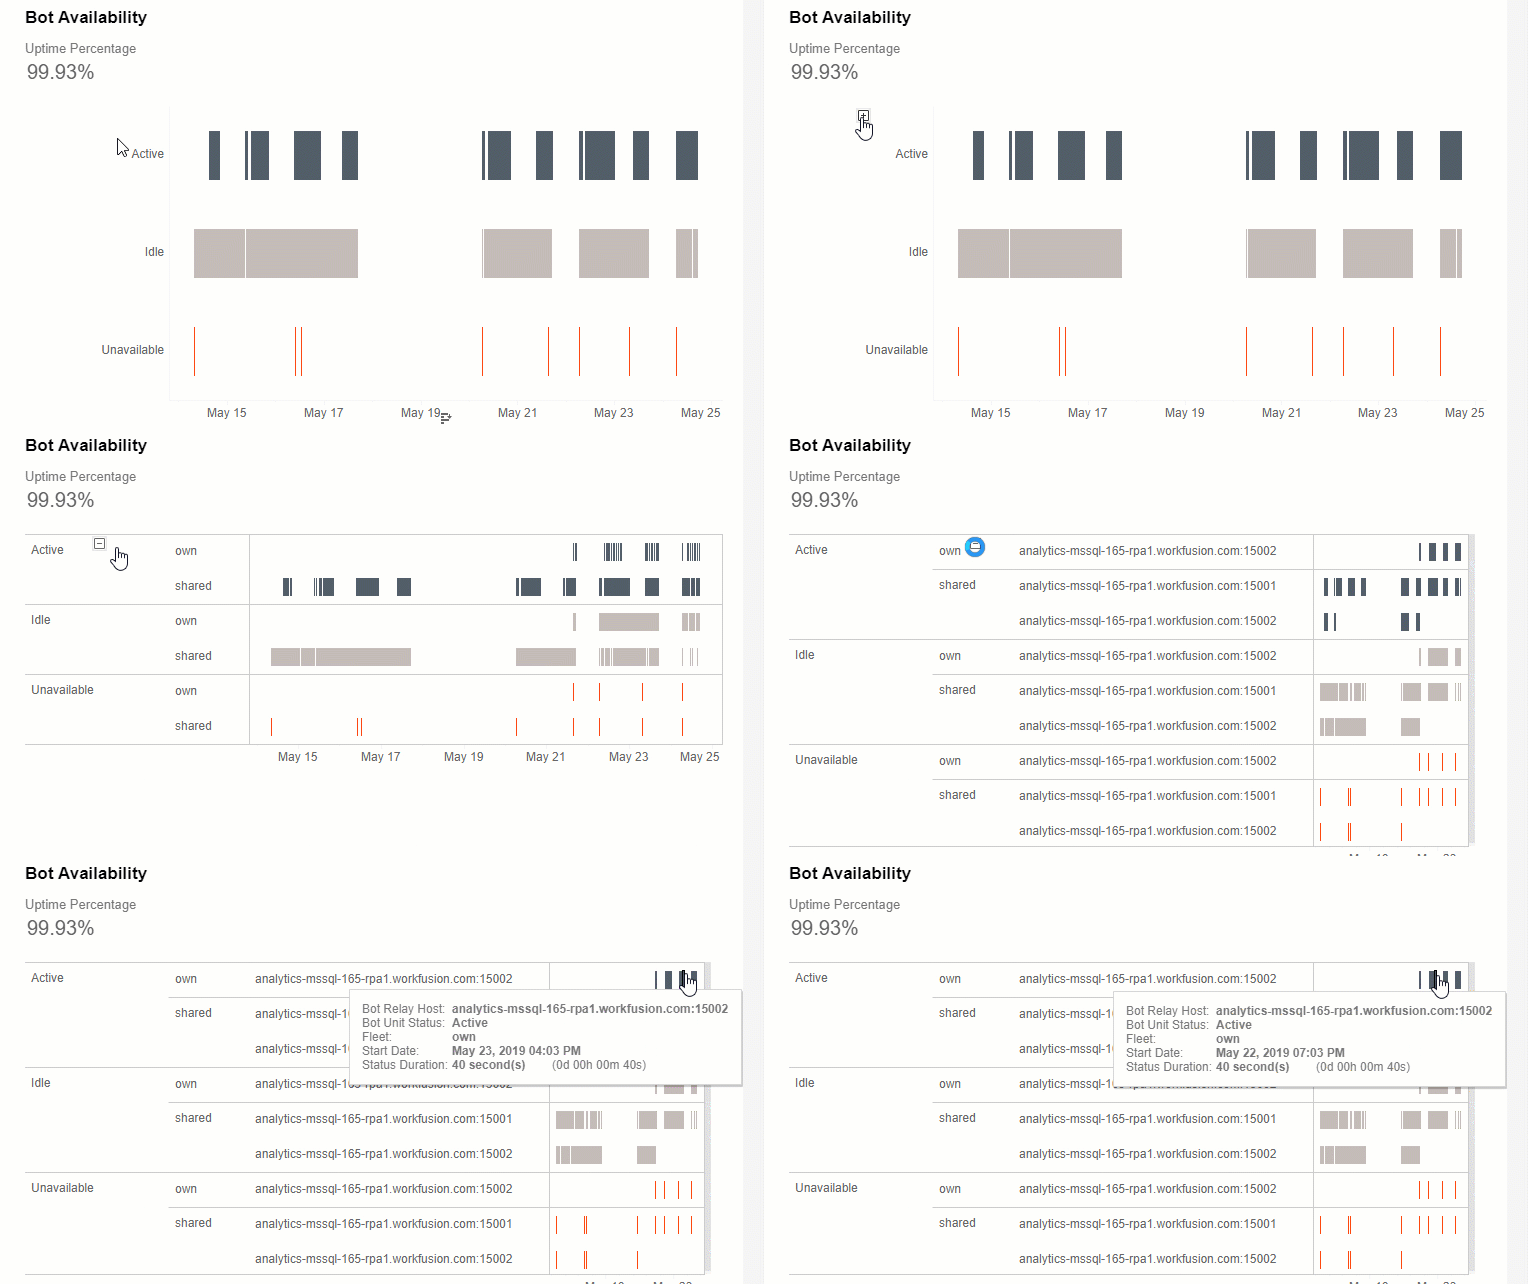
The Uptime Percentage element shows the percentage of time when Bot Units were active or idle. By default, the aggregated view is enabled.
The bot status indication is as follows:
- Gray—active
- Light gray—idle
- Red—unavailable
The detailed view shows bot statuses per Fleets and Bot Units. It is possible to drill down to a separate process as shown in the example below:
RPA Accuracy Rate
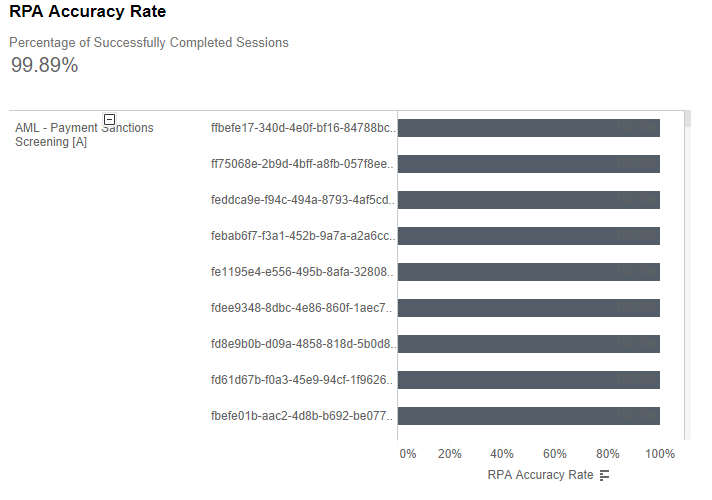
The RPA Accuracy Rate chart shows the percentage of successfully completed sessions per Process Name over a selected period.
By default, the aggregated view is enabled. It's possible to drill down to an individual process as shown in the example below:
Tasks Comparison
The Tasks Comparison chart compares entities by the average Execution and Wait Time (in seconds). Available entity types are as follows:
- Tasks
- Processes
- Fleets
- Bot Units
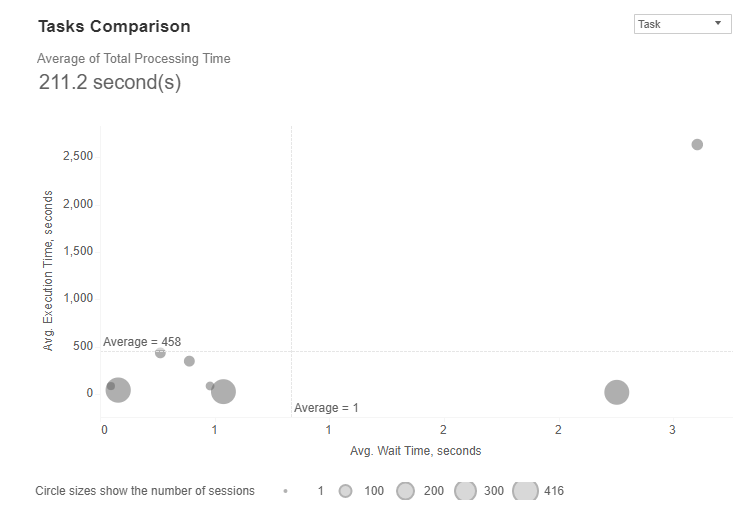
The circle size represents the number of sessions with given average Execution and Wait Times. The closer an entity is to the bottom left, the better: it means low wait time and fast execution. The closer circles are to each other, the more stable execution is. Otherwise, it is an indication that work volumes within sessions vary, or there is an execution bottleneck.
To switch between entities, use the drop-down box shown below:

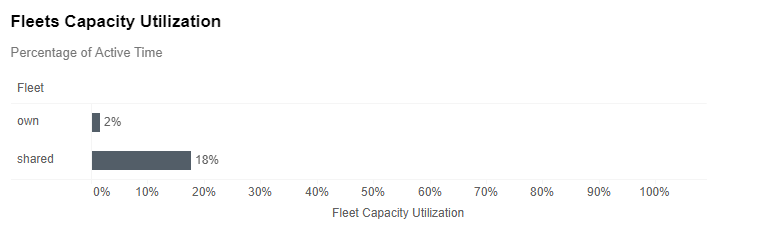
Fleets Capacity Utilization
Fleets Capacity Utilization is calculated based on the percentage of the time Bot Units in a given Fleet were active:
Volume per Fleet
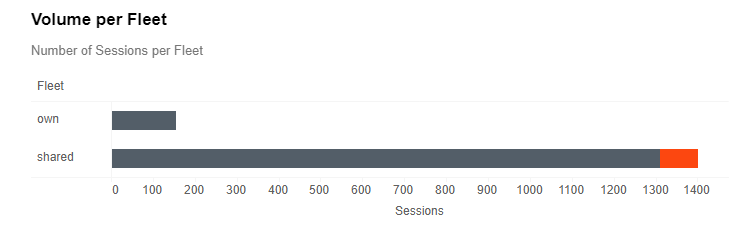
The Volume per Fleet chart shows the number of sessions processed by Bot Units with a given Fleet:
Bot Unit Sessions
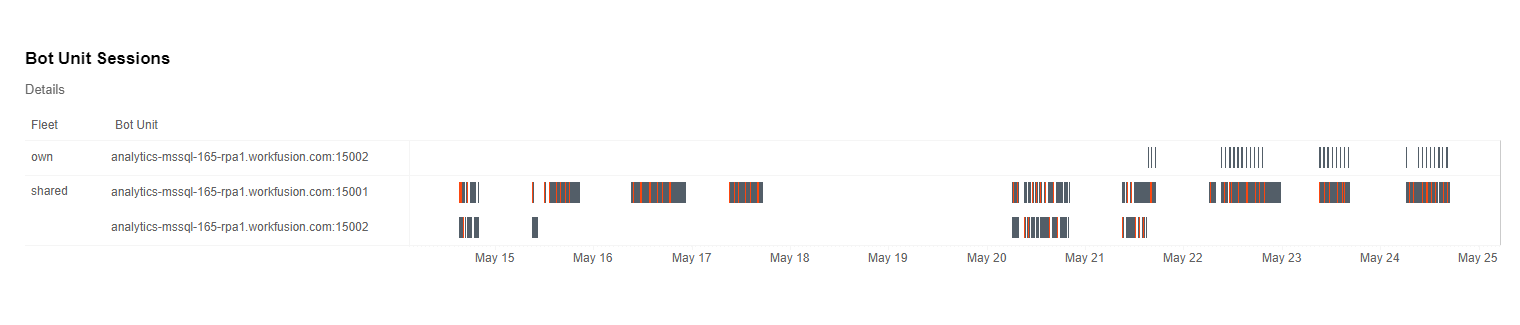
The Bot Unit Sessions chart visualizes the session flow per Bot Units grouped by fleets:
The following Session Statuses are possible:
Gray—successful
Red—failed
A failed session tooltip also contains a message explaining the associated error.