
View and manage worker data in Control Tower
View All Workers
To view and manage workers in Intelligent Automation Cloud, navigate to Workers > View All Workers.
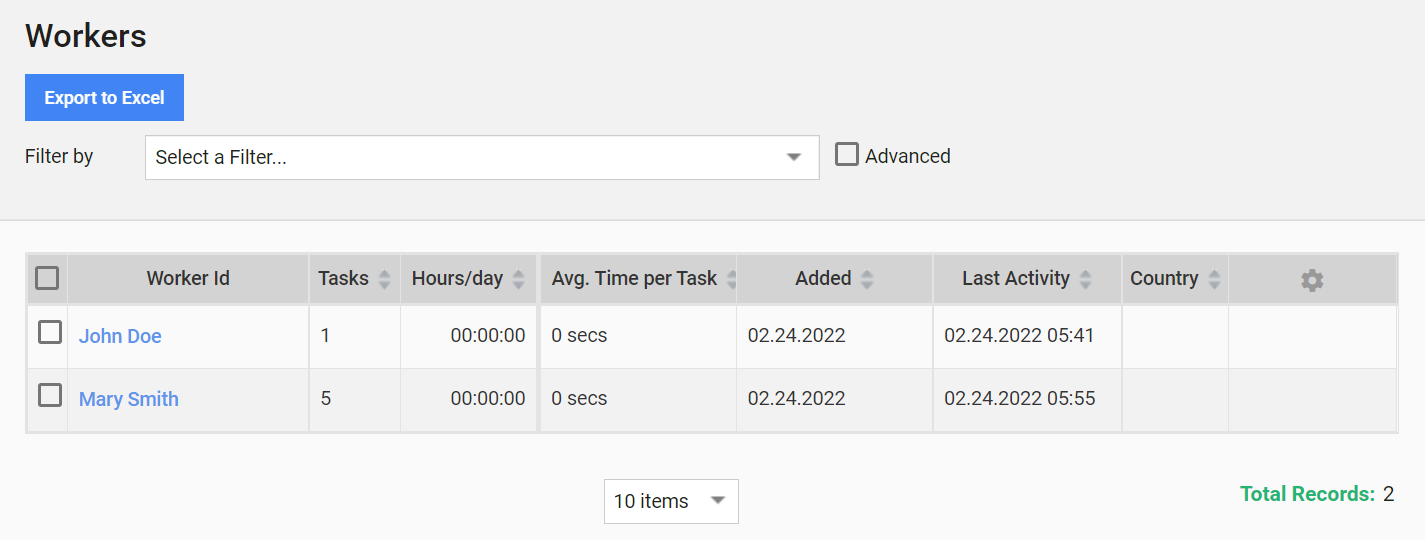
The grid contains all workers who have submitted tasks or sent feedback on a task, including Bot Workers. It has horizontal scrolling, and you can manage the number of displayed columns by clicking the cogwheel in the top right corner.
The following actions are available for the grid data:
To export the list of workers to an Excel spreadsheet, click the Export to Excel button.
To narrow down the number of workers displayed in the grid, apply filters. For a detailed description of the filtering function, refer to the Workers topic.
The grid can contain the following columns:
| Column heading | Description |
|---|---|
| Worker Id | System-generated unique identification number assigned to each worker. |
| Tasks | The total number of tasks completed by the worker. |
| Hours/day | Total hours and days spent by the worker on tasks. |
| Avg. Time per Task | The average time the worker spends per task. |
| Added | The date and time when the worker was added to the system. |
| Last Activity | The date of the last recorded worker action, for instance, submission or feedback. |
| Country | The country of origin associated with the worker. |
Manage worker profile
To view a worker profile, go to the Worker Id column and click an appropriate record.
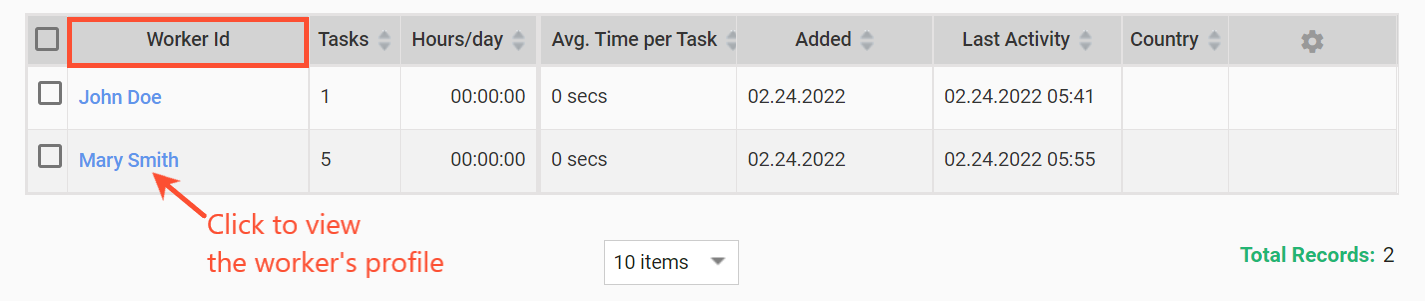
Alternatively, you can navigate to a worker profile from the Workers > Results in a specific Manual Task.
These actions open the Worker Profile page shown below.
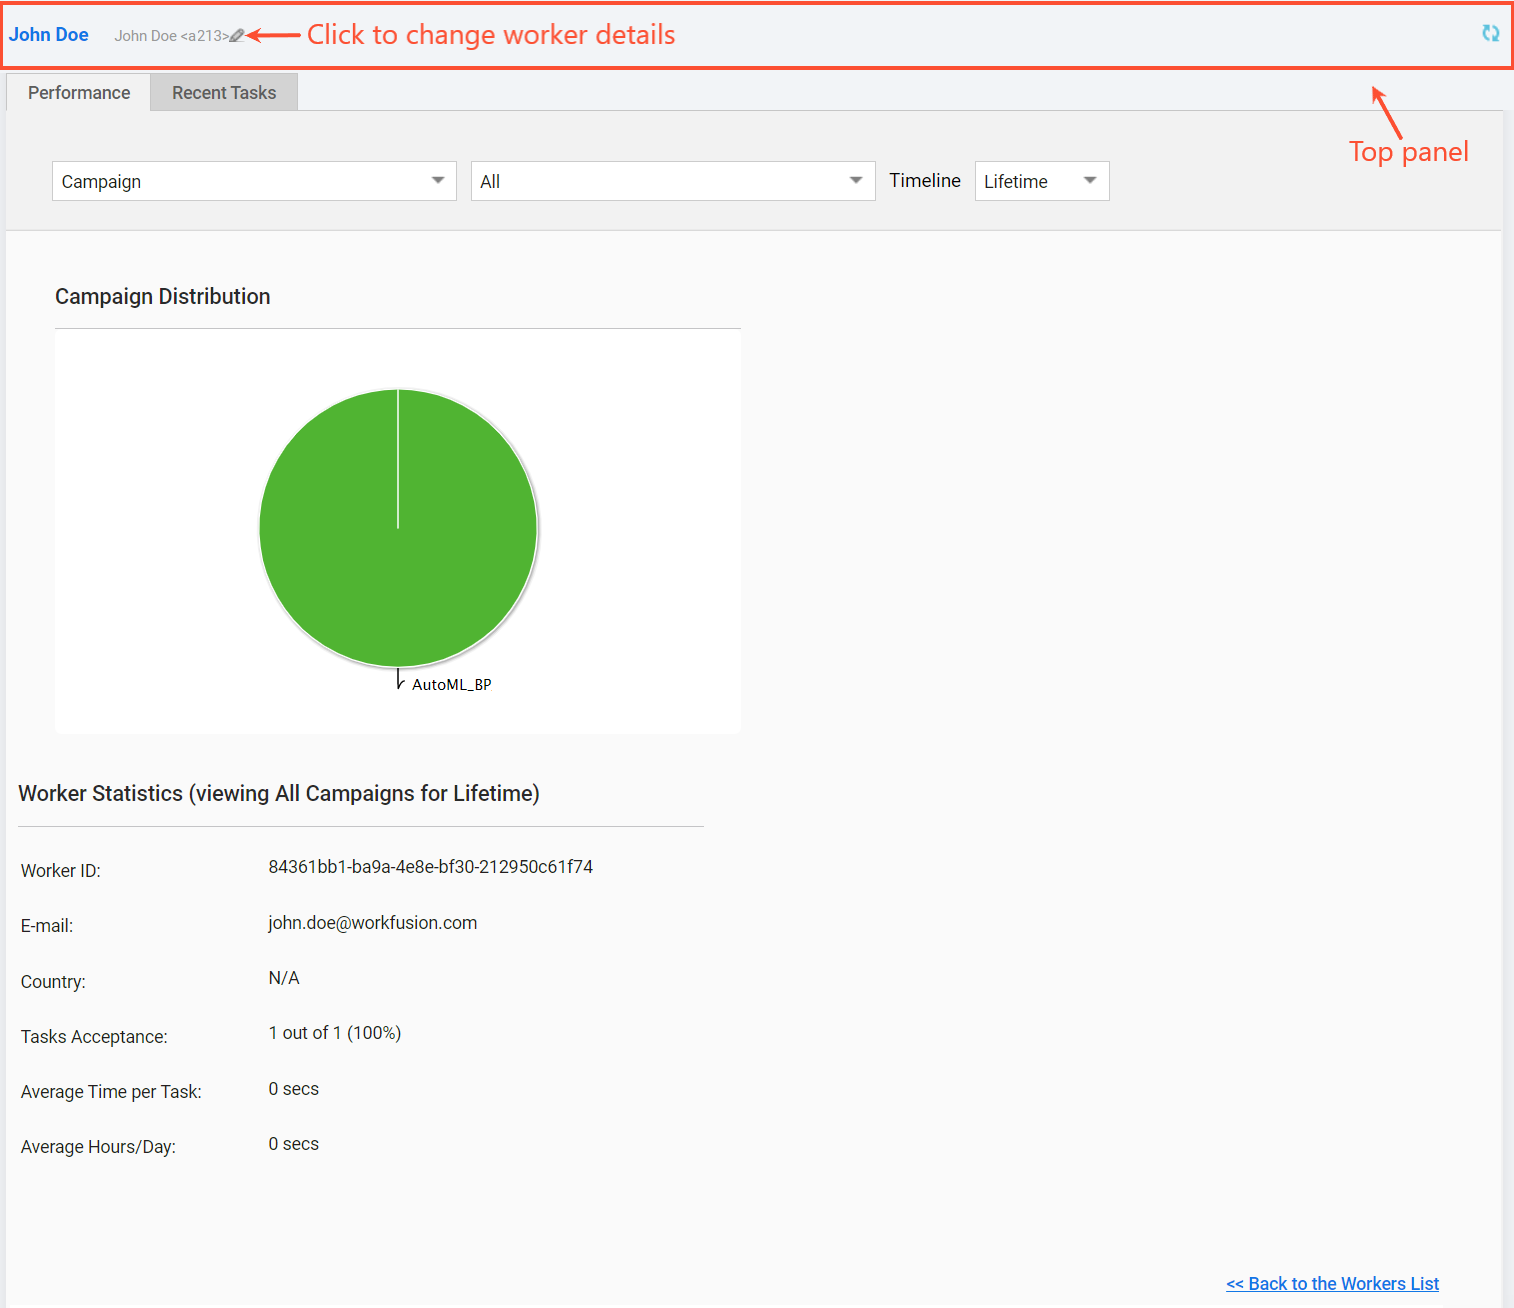
The top panel can contain the worker's ID, name, and comments or notes. To modify any of the details, hover over the worker's name and click the pencil icon.
Performance
The Performance tab contains overall worker statistics displayed in tables and pie charts.
You can filter the data by the following parameters:
- Campaign, meaning a Manual Task or a Business Process (BP), or Operation
- All or a particular Manual Task, BP, Operation
- Timeline: a period to display data
Charts
On the Performance tab, you can see the Campaign Distribution chart. It displays how many tasks a particular worker submitted in a Campaign (Manual Task or BP). Among other factors, this allows you to identify the preferred type of tasks for the worker.
Worker statistics
The grid contains key worker parameters calculated based on the worker's activity.
Recent Tasks
The Recent Tasks tab provides information about the tasks completed by a specific worker.
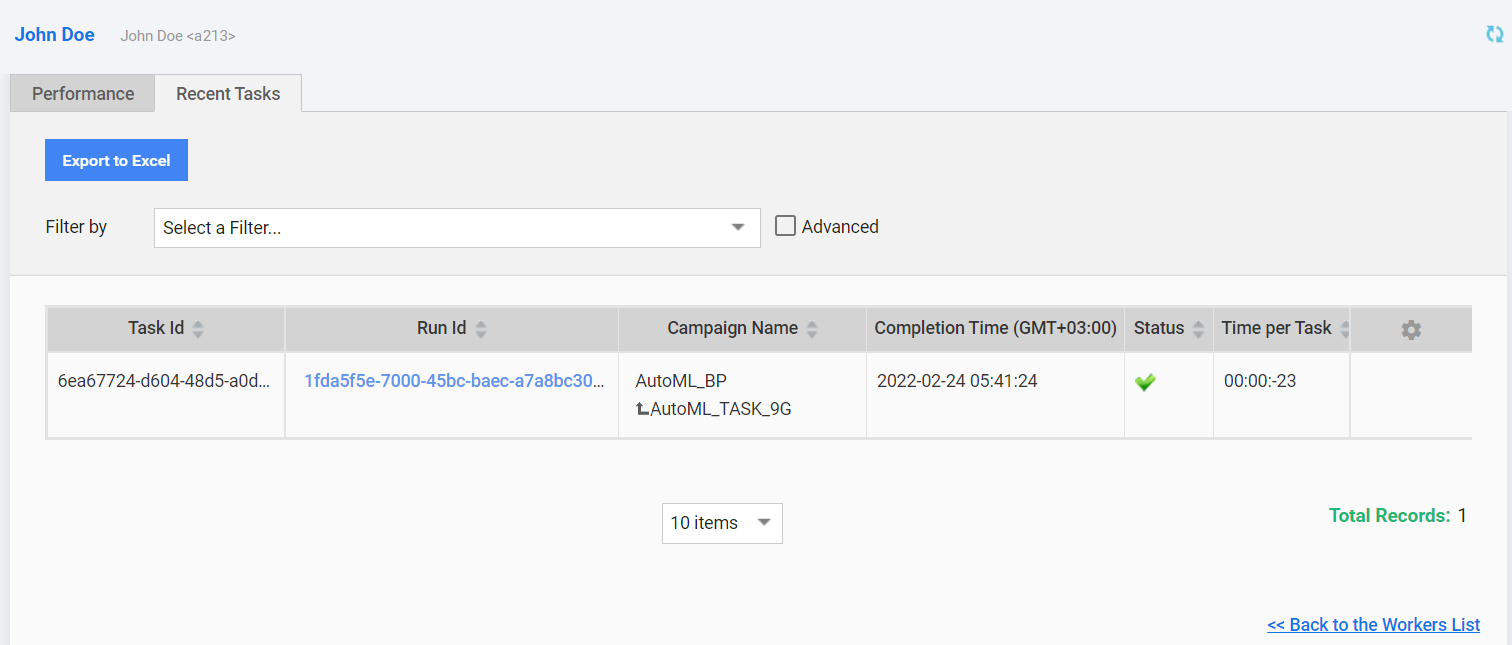
On the tab, you can perform the following actions:
- Export to Excel
- Filter the tasks
- Navigate to a specific task, run, or campaign (BP or Manual Task) by clicking the Task Id, Run Id, or Campaign Name accordingly