
Run Manual Task and view results
Run Manual Task
After you upload task data, build the task design, and set the run options, perform the following actions:
Run the task in the development environment by clicking the Run This Task button on the Run tab.
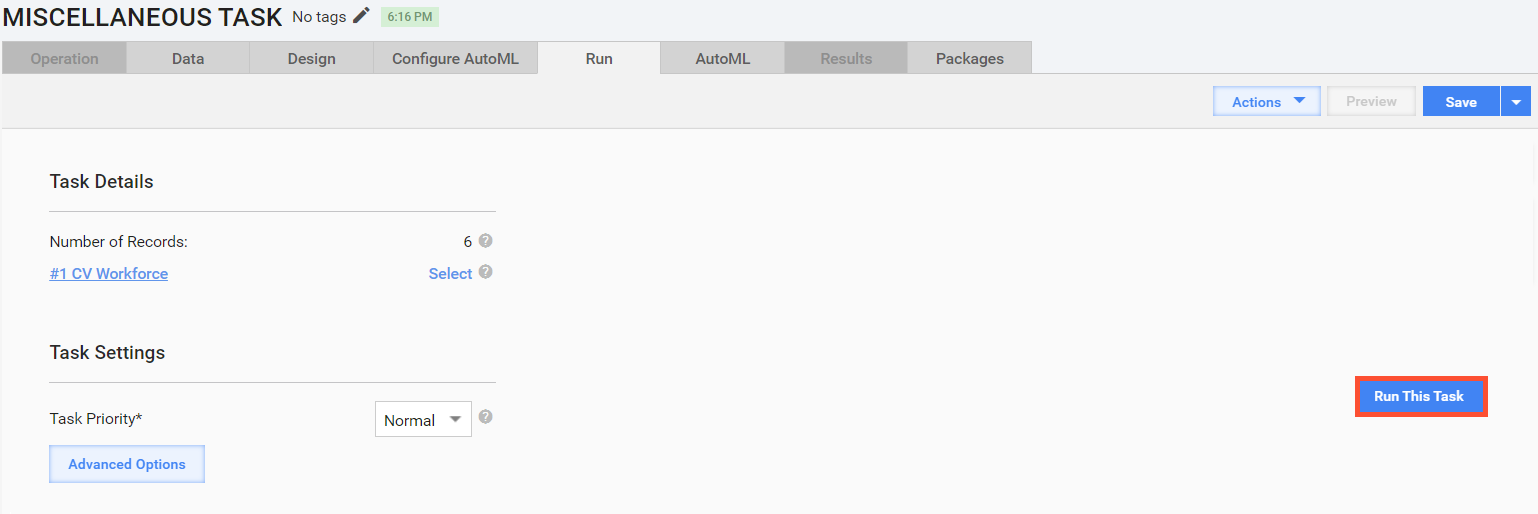
If the task has started successfully, you see the following message: Run Started Successfully! You can view the results of the task or view the task you have just created via the Manual Tasks list.
Log in to WorkSpace, find the task by the name or a keyword, and try to complete it.
Go back to Control Tower and edit the task options, design, or data if needed.
Copy the task with data. You can optionally stop or delete the original task if needed.
Run the task in the production environment by selecting the appropriate checkbox above the Run This Task button.
View results
To view the results of a Manual Task with key parameters and links, navigate to Results > Summary.
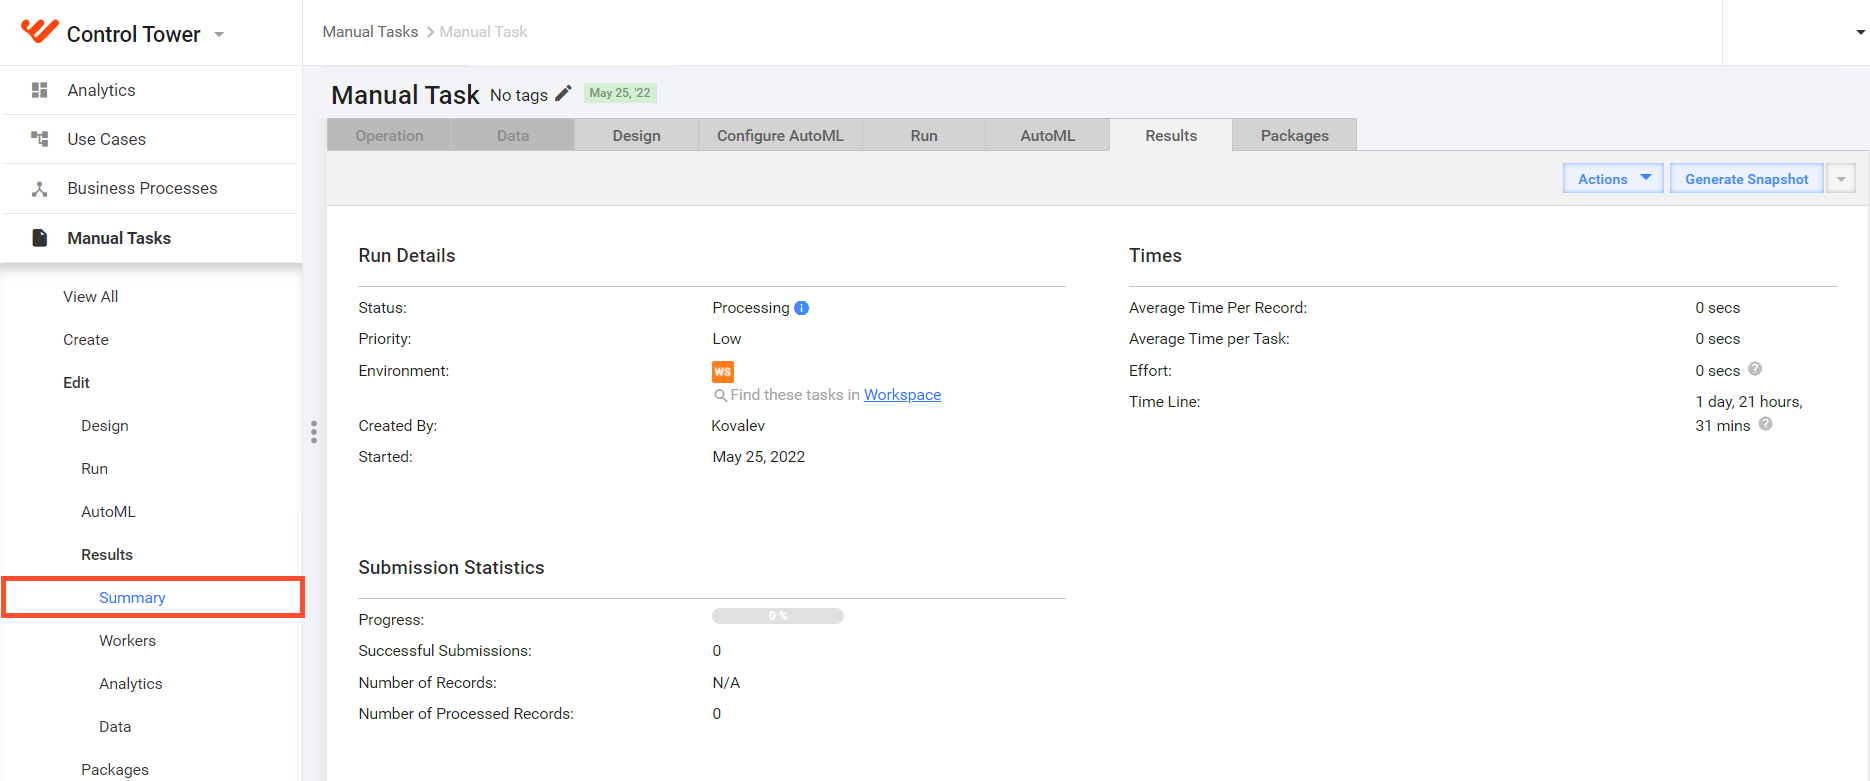
Run Details
The table below lists the data displayed in the Run Details section.
| Field | Description |
|---|---|
| Status | This field indicates whether the task is completed, paused, or still processing. To view all task events, click the blue info icon. |
| Priority | The task can have normal, high, or low priority. |
| Environment | This field displays two pieces of information about the environment. In the screenshot above, you can see a WS icon indicating that the task was posted to WorkSpace. Clicking the icon brings you to WorkSpace. |
| Created By | The task author's username. |
| Started | The date when the task was run. |
| Finished | If the task is completed, the date when it was finished. |
Submission Statistics
The table below lists the data displayed in the Submission Statistics section.
| Field | Description |
|---|---|
| Progress | A progress bar showing the percent of successfully submitted Records |
| Successful Submissions | The total number of successful submissions |
| Number of Records | The total number of Records in the input data file |
| Number of Processed Records | The total amount of Records with processed data |
Times
The table below lists the data displayed in the Times section.
| Field | Description |
|---|---|
| Average Time per Record | The average time workers spent on a Record |
| Average Time per Task | The average time workers spent on a task |
| Effort | The total combined time workers spent on the task |
| Time Line | The total time spent since the task start |