Platform Monitor Proactive Monitoring
Overview
The purpose of Proactive Monitoring is to early detection of the problems before they can affect application in any negative way.
We support the following types of proactive checks:
- Anomaly detection
- Forecasting metrics
- Trend analysis
Anomaly detection allows analysis of large range of time series data for anomaly points (outliers). Examples can be unusual CPU utilization, spikes int task processing times
Forecasting metrics is a way to predict some metric in future using history of values as the model. This allows to predict disk space problems in recent future or licences issues.
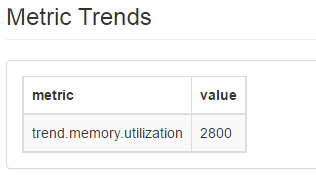
Trend analysis compares current value with the the past to calculate different over time. This can be used to detect rapid grows in some metrics
Prerequisites
WorkFusion agent should be configured to dump periodically all metrics to MongoDB. This is enabled in the configuration of master agent. Please refer to configuration guide for details
WorkFusion Agent configuration
Anomaly detection
CPU Utilization will be an example metric.
Input data
| Metric | Graph | As seen in APM |
|---|---|---|
| cpu.high |
|
 |
| cpu.low |
|

|
| cpu.normal |
 |

|
| cpu.spike |
|
|


Check configuration
checks:
  - id: proactive
    type: analysis                                     # Check to retrieve timeseries data
    expression: cpu.low                                # Metric name to analyse
    source: Mongo                                      # Datasource name with timeseries data
    schedule: 3600                                     # Run every 1 hour
    parameters:
      ts_from: 300 # Get timeseries data from 5 hours
      TS_MODEL: WeightedMovingAverageModel             # Model name to use for forecasting
      AD_MODEL: ExtremeLowDensityModel                 # Model name to use for anomaly detection
      AUTO_SENSITIVITY_ANOMALY_PCNT: 0.0001            # Expected % of anomalies in data
      THRESHOLD: "mase#5"                              # specifies the threshold for the anomaly detection model
    evaluate:
      - id: anomaly.egads                              # Function to run anomaly detection
Alert configuration
alerts:
  - id: proactive
    triggers:
      - { metric: proactive.anomaly.egads, gt: 0, message: "Found anomalies in CPU metric", type: performance }
Expected alert issue
[{
  date: "2016-07-08 13:25:43",
  id: "proactive",
  size: 1,
  issues: [{
    metric: "proactive.anomaly.egads",
    trigger: "gt 0.0",
    observed: "2.0",
    description: "Found anomalies in CPU metric",
    dependsOnFailed: false,
    status: "PERFORMANCE"
    }],
  dependsOnFailed: false
}]
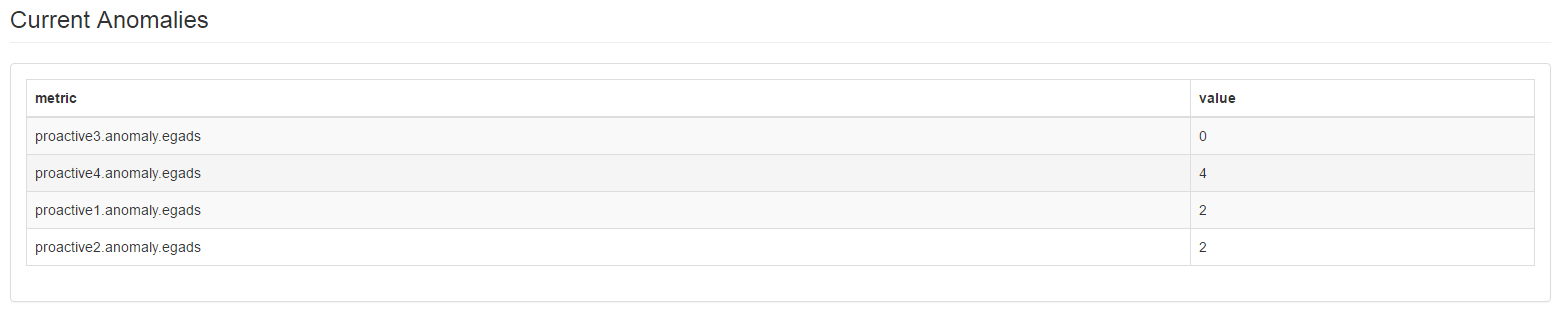
Output anomalies metrics
Forecasting metrics
Free disk space will be an example metric.
Input data
| Metric | Graph | As seen in APM |
|---|---|---|
| disk.decreasing |
|

|

Check configuration
checks:
  - id: server.disk.forecast
    type: analysis
    expression: disk.decreasing
    source: Mongo
    schedule: 60
    parameters:
      ts_from: 60
    evaluate:
      - { id: forecast.regression, arg: 5, type: double, metric_name: 5m }
      - { id: forecast.regression, arg: 120, type: double, metric_name: 1h }
      - { id: forecast.regression, arg: 4320, type: double, metric_name: 3d }
Alert configuration
alerts:
  - id: disk.prediction
    triggers:
      - { metric: server.disk.forecast.5m, lte: 0, type: performance, message: "Disk will be used in 5 minutes" }
      - { metric: server.disk.forecast.1h, lte: 0, type: performance, message: "Disk will be used in 1 hour" }
      - { metric: server.disk.forecast.3d, lte: 0, type: performance, message: "Disk will be used in 3 days" }
Expected alert issue
[{
  date: "2016-07-08 15:23:29",
  id: "disk.prediction",
  size: 1,
  issues: [{
    metric: "server.disk.forecast.3d",
    trigger: "lte 0.0",
    observed: "0.0",
    description: "Disk will be used in 3 days",
    dependsOnFailed: false,
    status: "PERFORMANCE"
  }],
  dependsOnFailed: false
  }
]
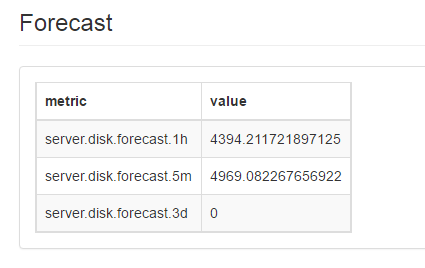
Output forecast metrics
Trend analysis
Input data
Memory utilization will be example metric
| Metric | Graph | As seein in APM |
|---|---|---|
| memory.utilization |
|
 |

Check configuration
checks:
  - id: trend
    type: analysis
    expression: memory.utilization
    source: Mongo
    schedule: 600
    parameters:
      ts_from: 60
      ts_aggregate: 5
    evaluate:
      - { id: trend, type: double }
Alert configuration
alerts:
  - id: memory.utilization
    triggers:
      - { metric: memory.utilization, gt: 1000, type: performance, message: "Memory utilization increased for last hour" }
Expected alert issue
[{date: "2016-07-11 08:44:10",
    id: "memory.utilization",
    size: 1,
    issues: [{metric: "trend.memory.utilization",
        trigger: "gt 1000.0",
        observed: "2200.0",
        description: "Memory utilization increased for last hour",
        dependsOnFailed: false,
        status: "PERFORMANCE"
    }],
    dependsOnFailed: false
}
]
Output trend metrics