
Platform Monitor UI
Dashboard
Provides quick overview of the components, alerts and incidents.
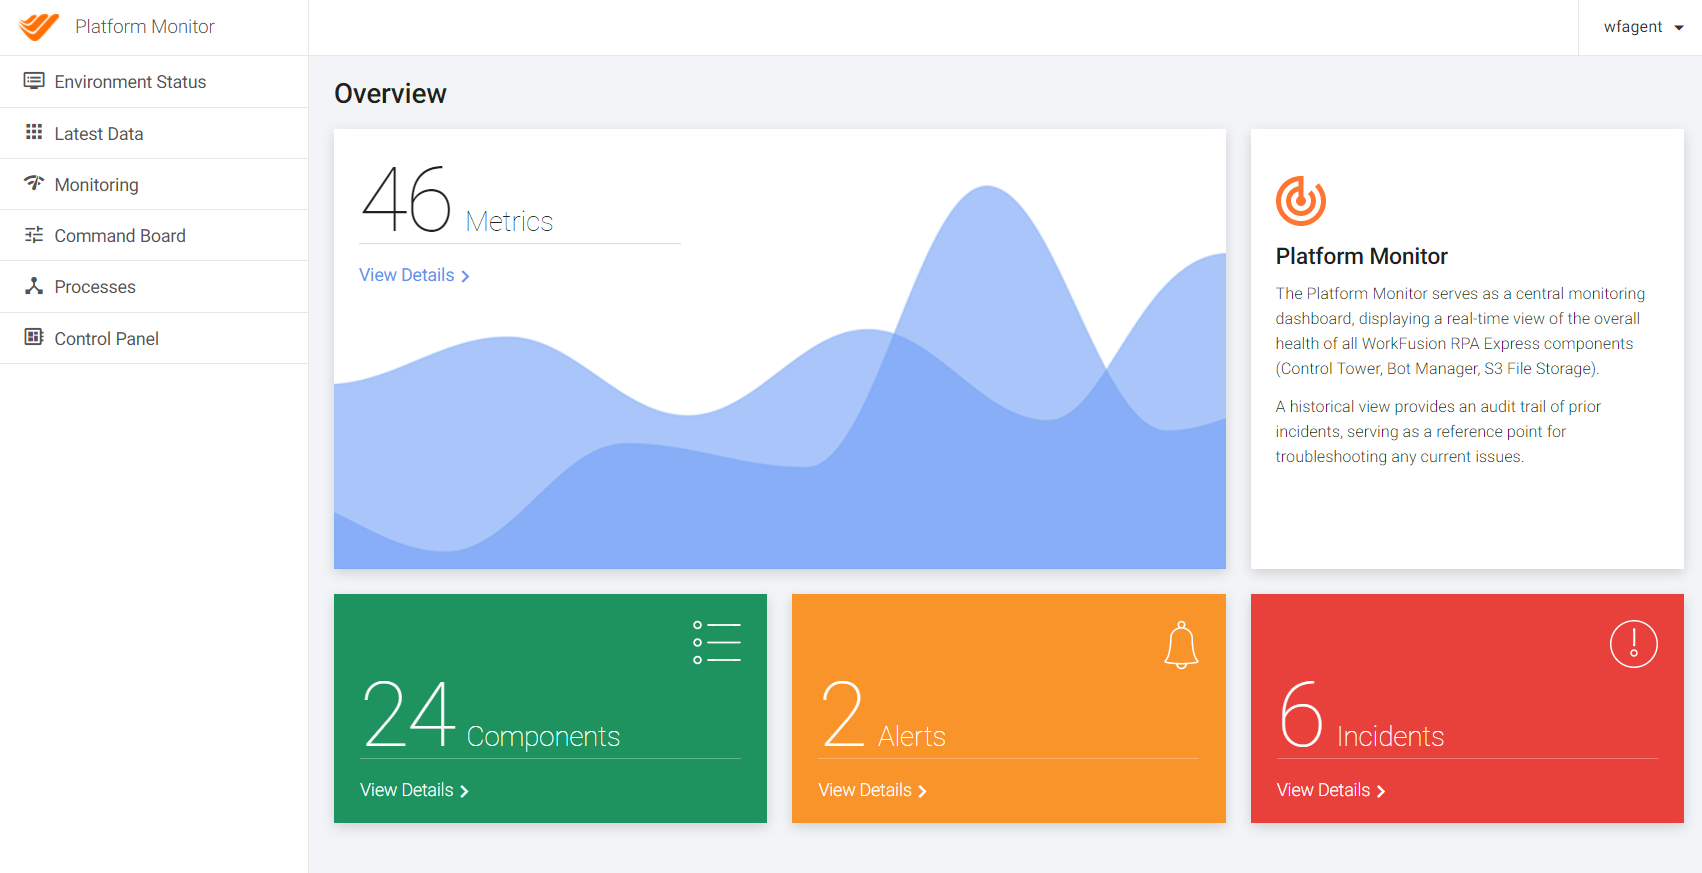
Environment status
Components
Provides summary of the system components with ability to get the messages about health and statuses.
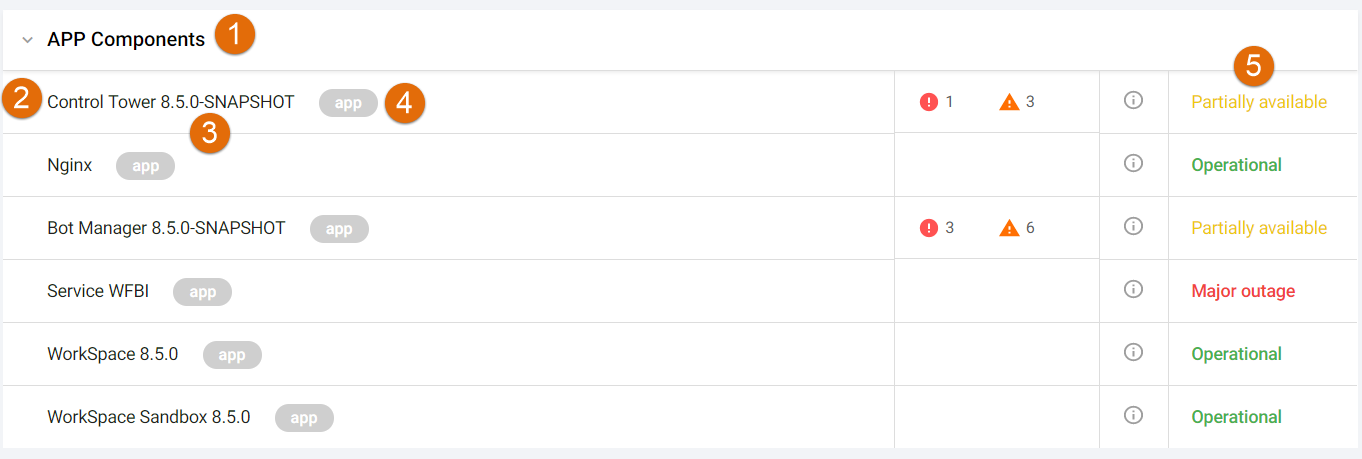
The component group name
Name of the component
Version of the component
Server name (Alias)
Component status - shows the status of the component and is clicklable. When have errors and warnings click on the status to see the list of incidents.
- Waiting for status: We are getting the response from component or it is not installed.
- Operational: The component is working.
- Partially available: The component is experiencing some slowness.
- Performance issues: The component may have some operational issues.
- Major Outage: The component is not operational.
Health Checks messages
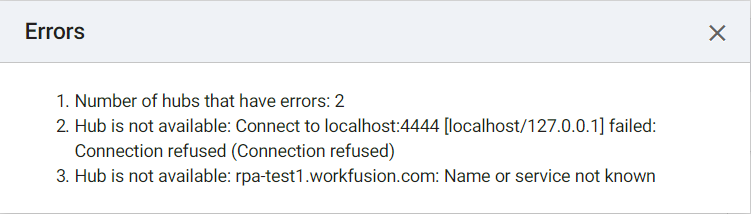
- Errors: critical issues found and requires immedeate attention and resolving for correct operation of the system, component may be in not operational state.
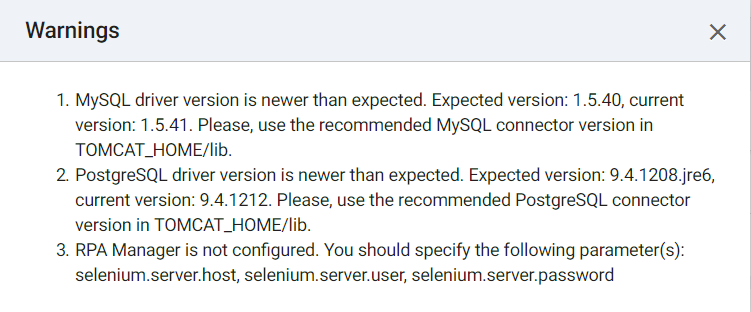
- Warnings: issues requiring attention, component may be in operational state.
- Info: information message about the component such as version, license, and so on.
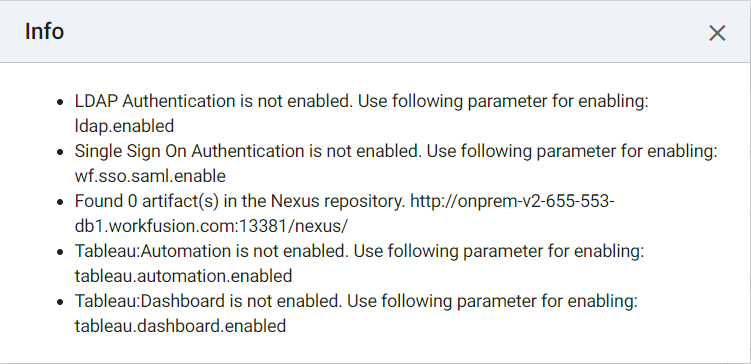
note
In the current version of Platform Monitor only the following components are providing the Health Checks information: Control Tower,
WorkSpace, OCR and RPA.
Incidents
Provides timeline log of the incidents.
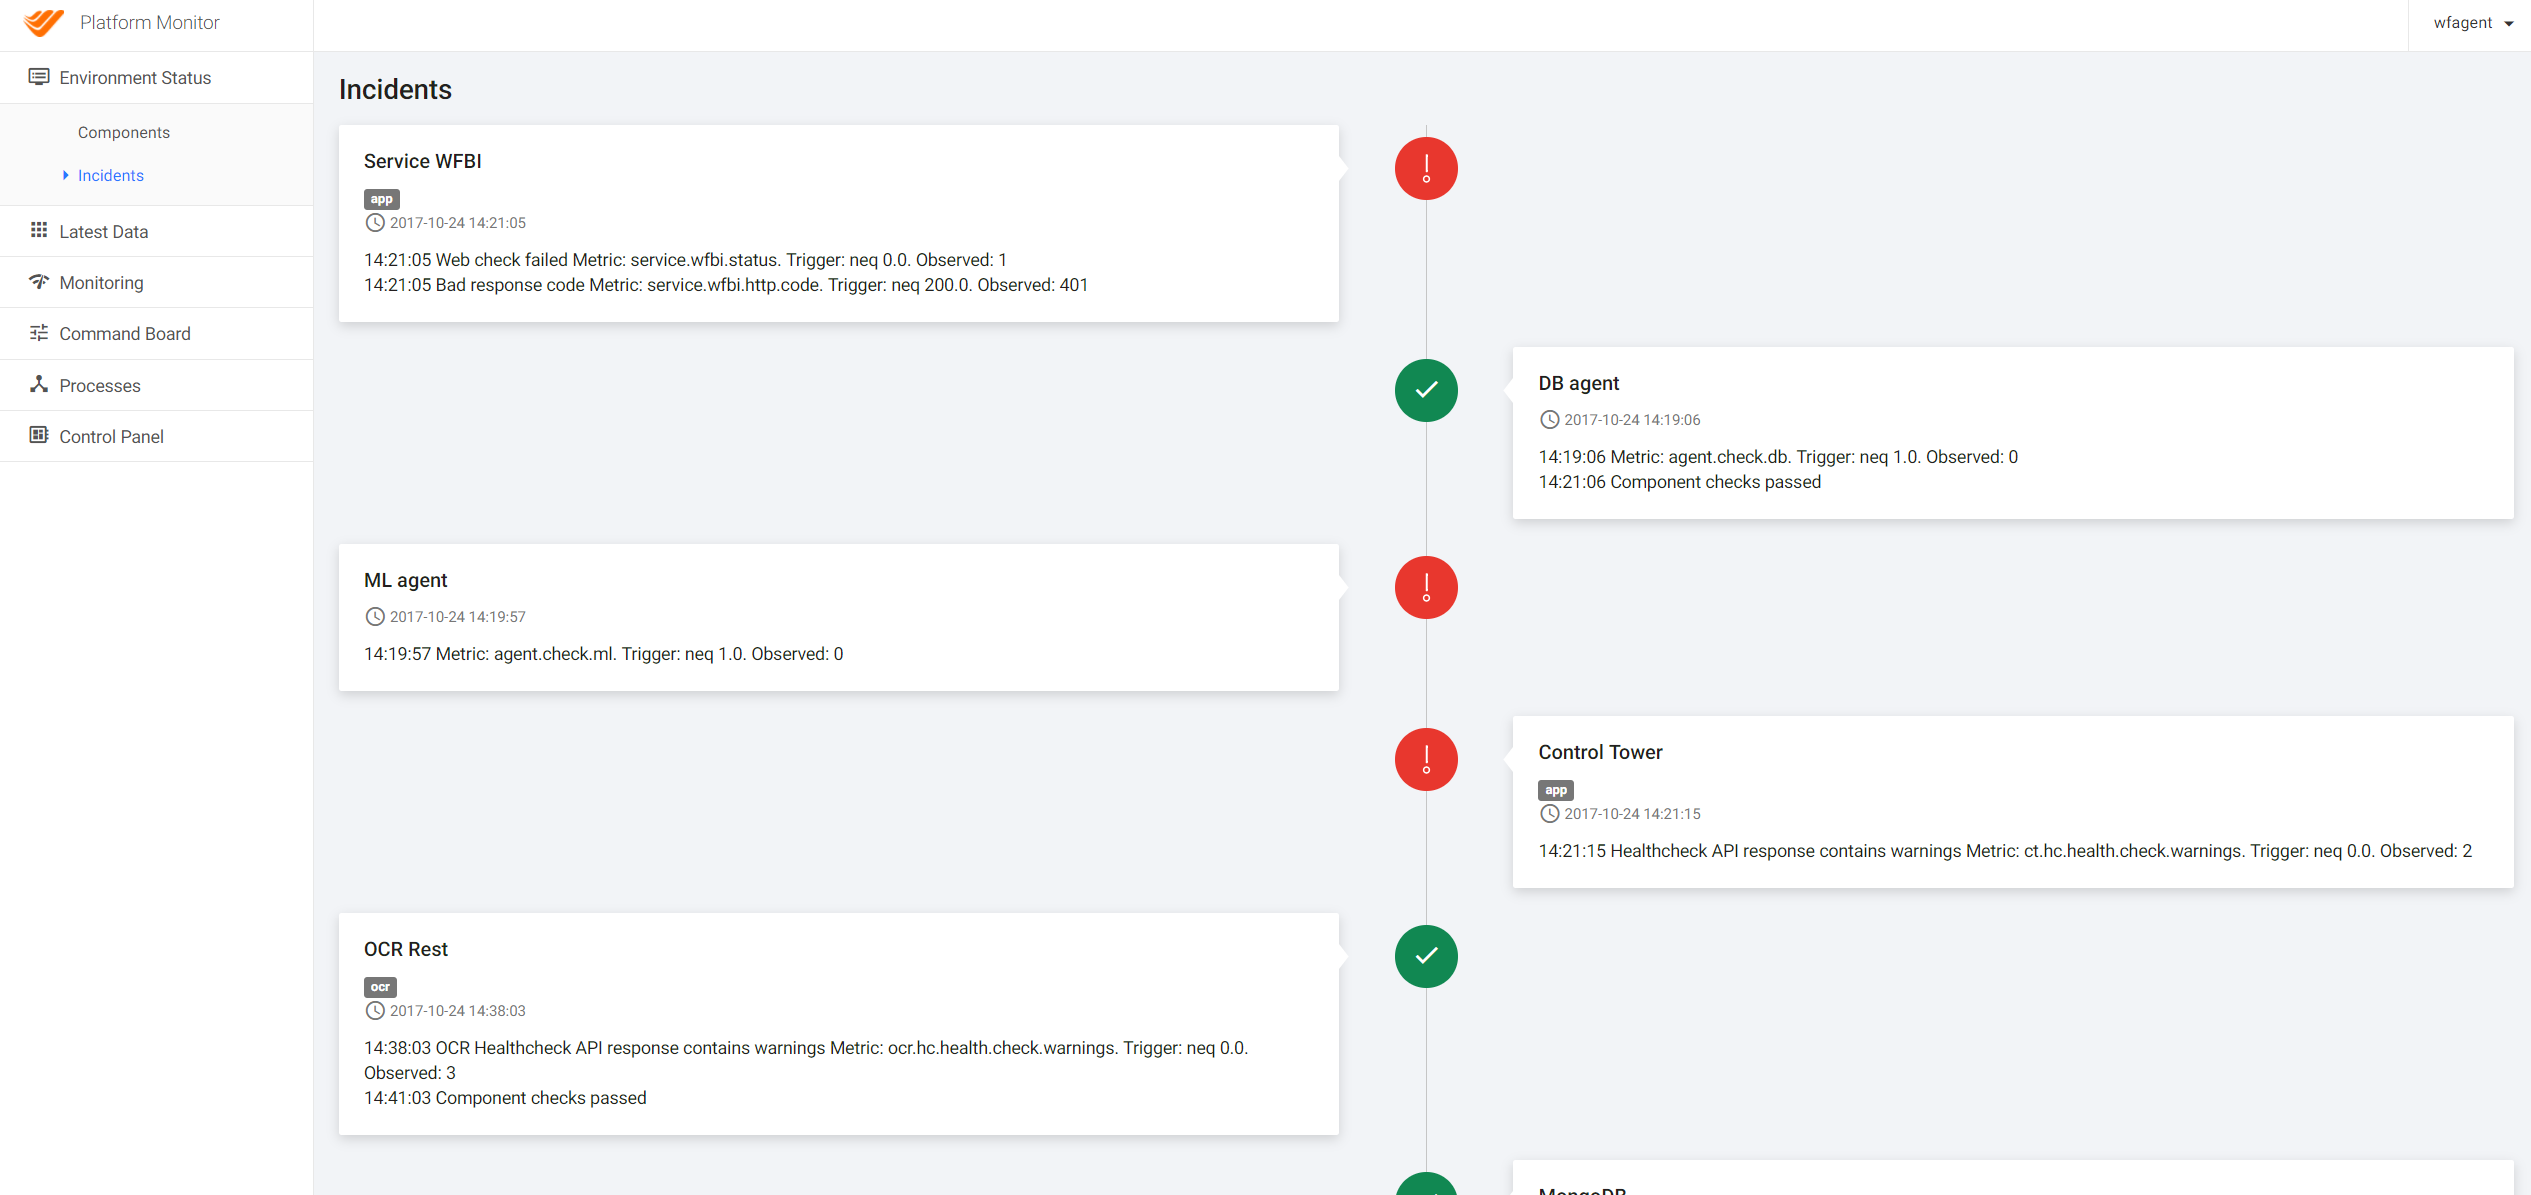
Incidents statuses are as follows:
- Investigating: You have reports of a problem and you're currently looking into them.
- Fixed: The fix has worked, you're happy to close the incident.
Latest data
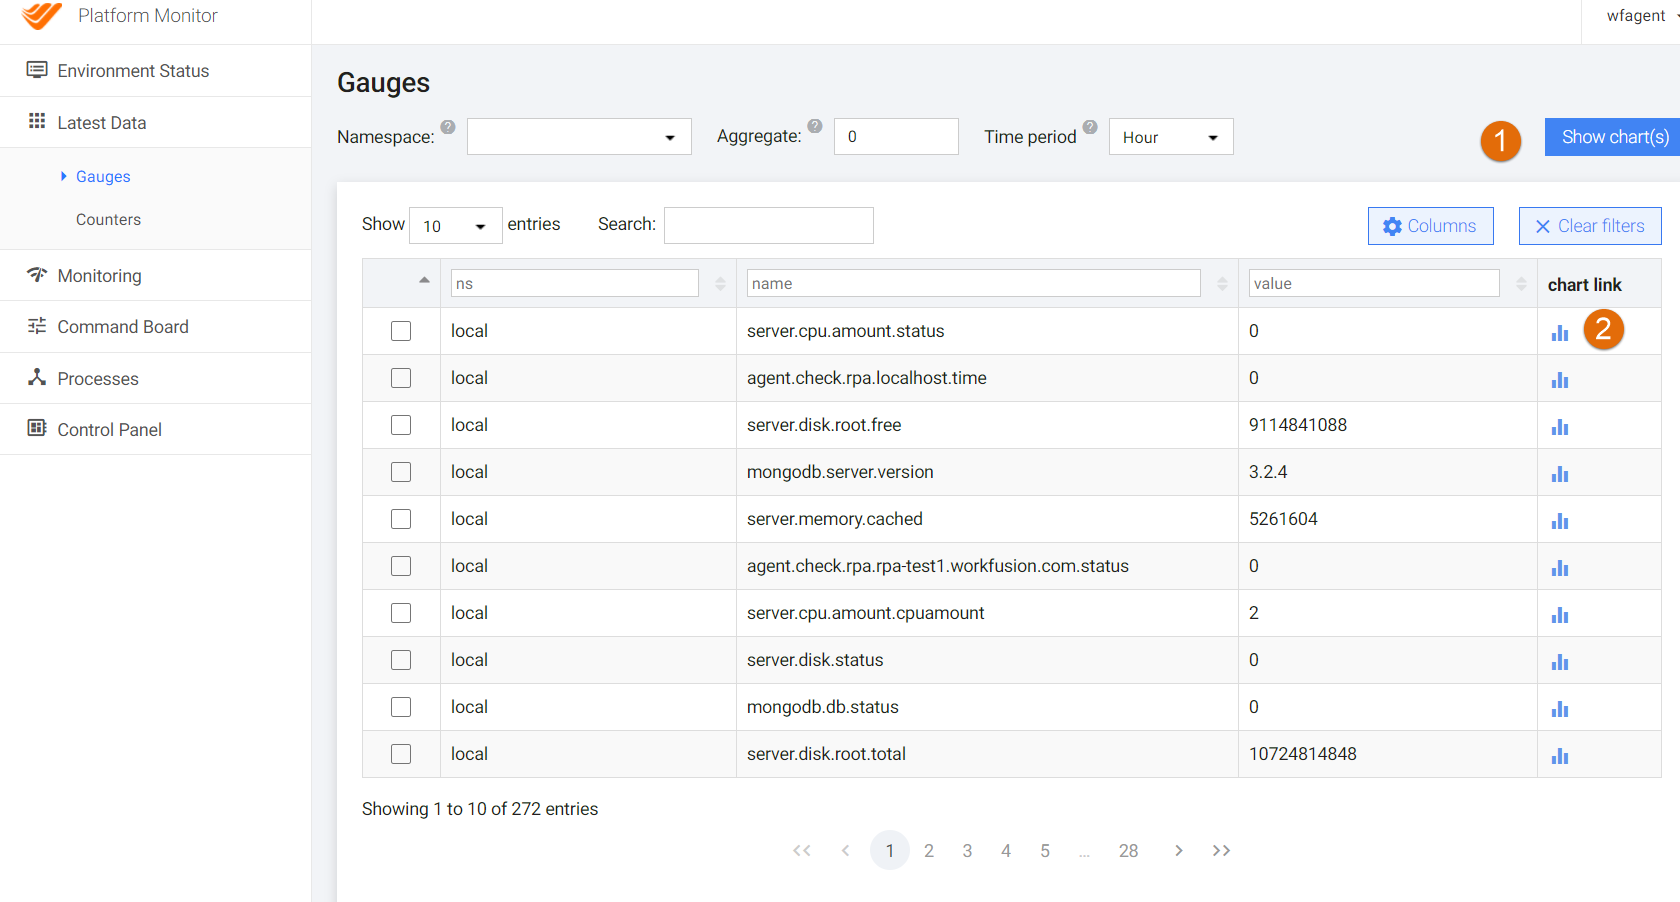
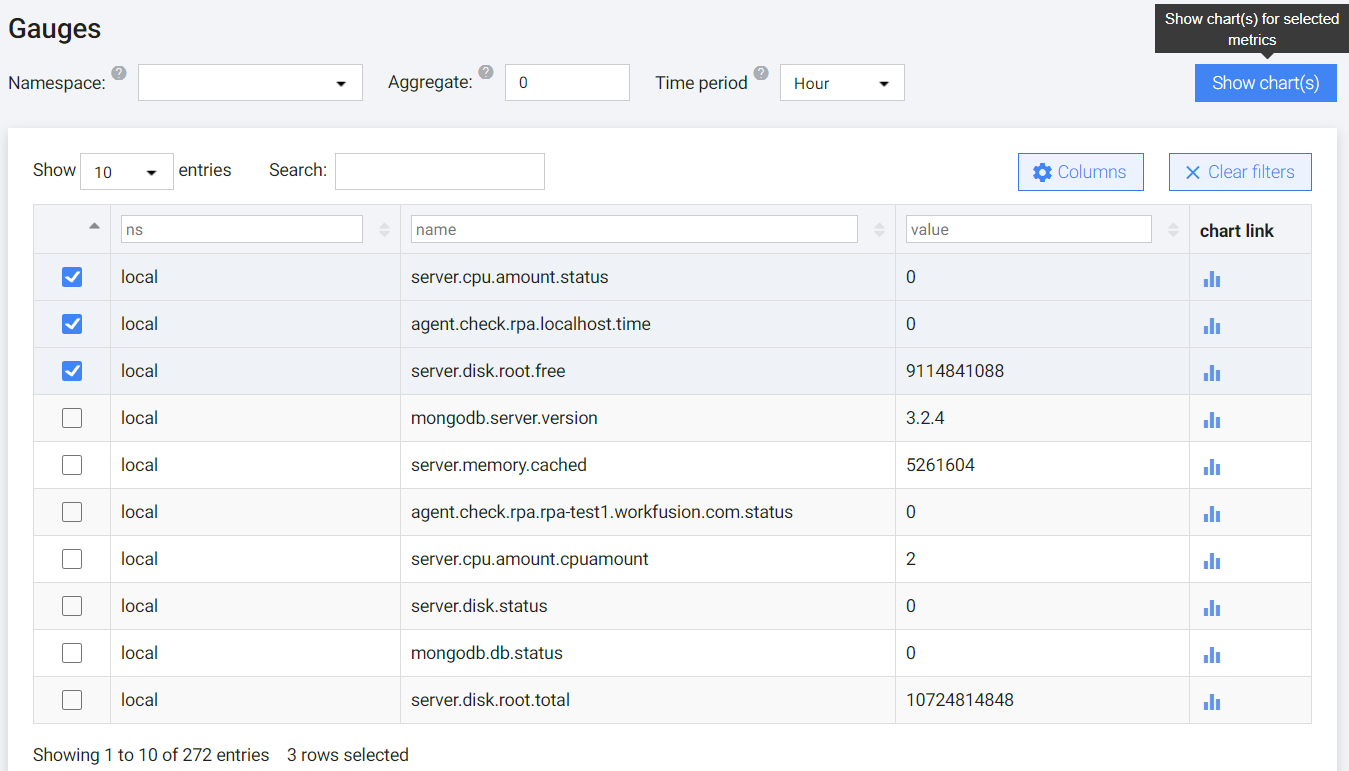
Provides ability to see the metrics change in time.
Bulk show of metrics graphics:
Single metric graphic:
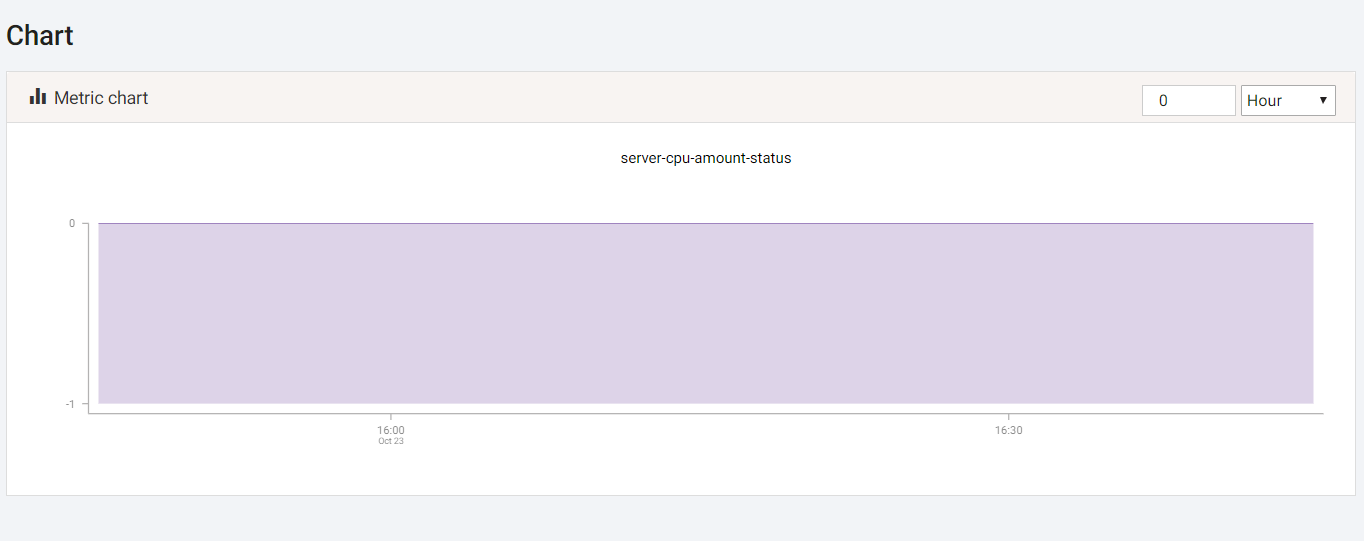
Monitoring
Alerts
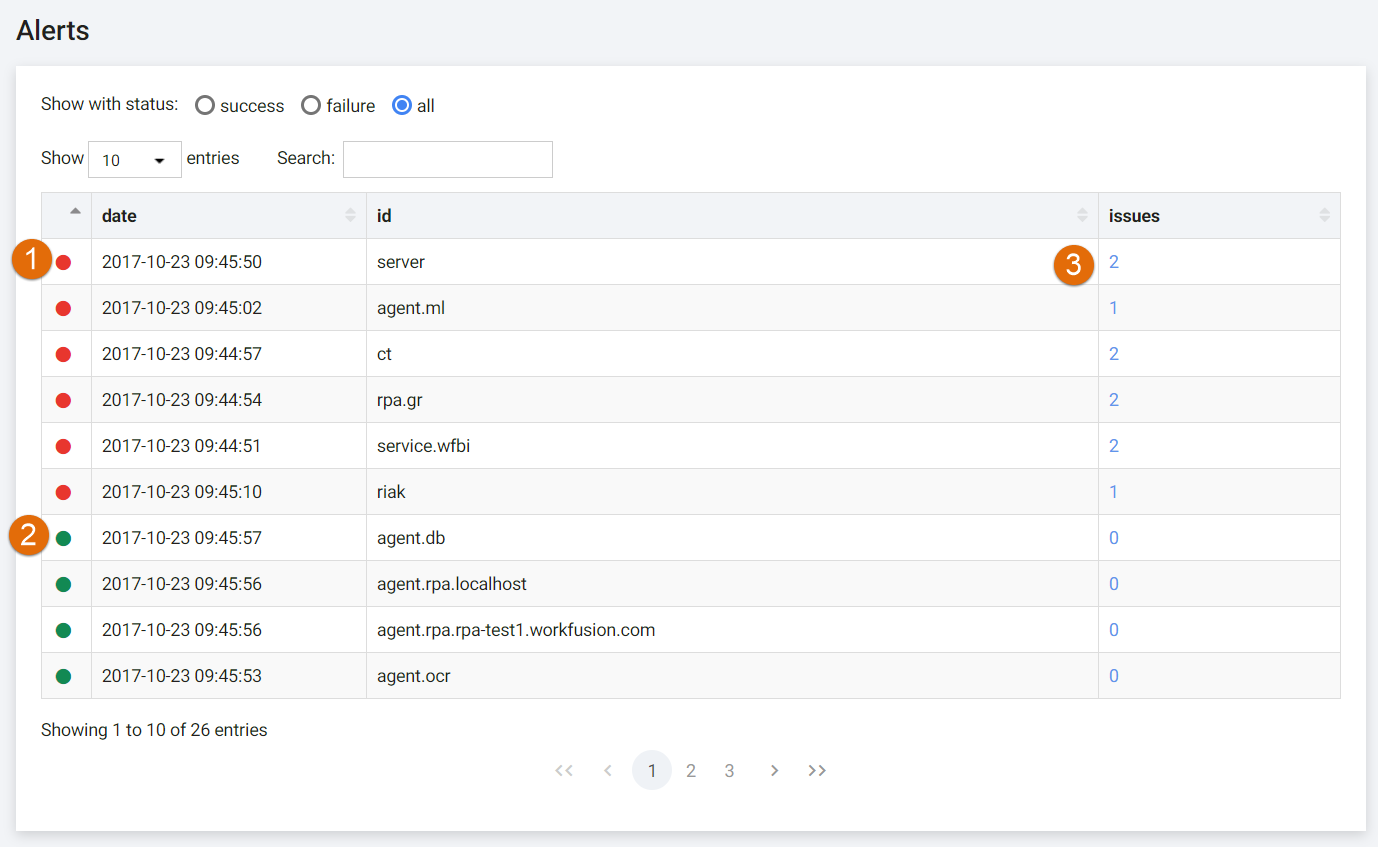
Alert about failure
Successfull check
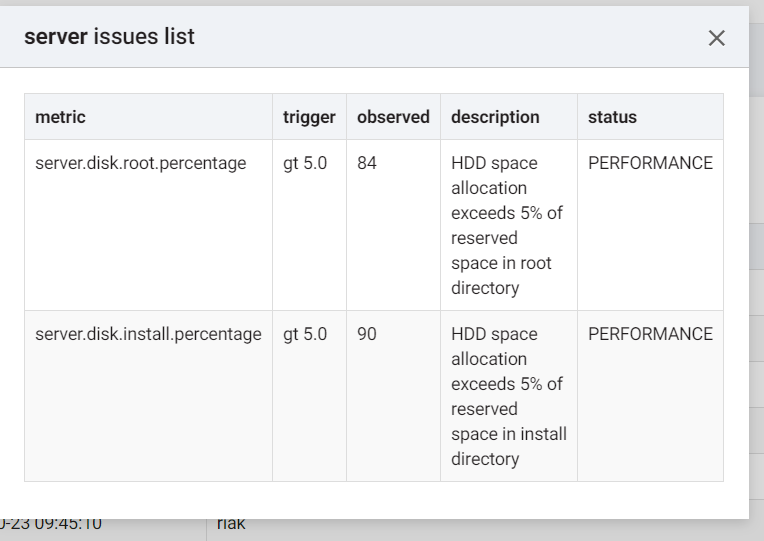
Allert issues pop-up
Anomaly
For more details, see Platform Monitor Proactive Monitoring.
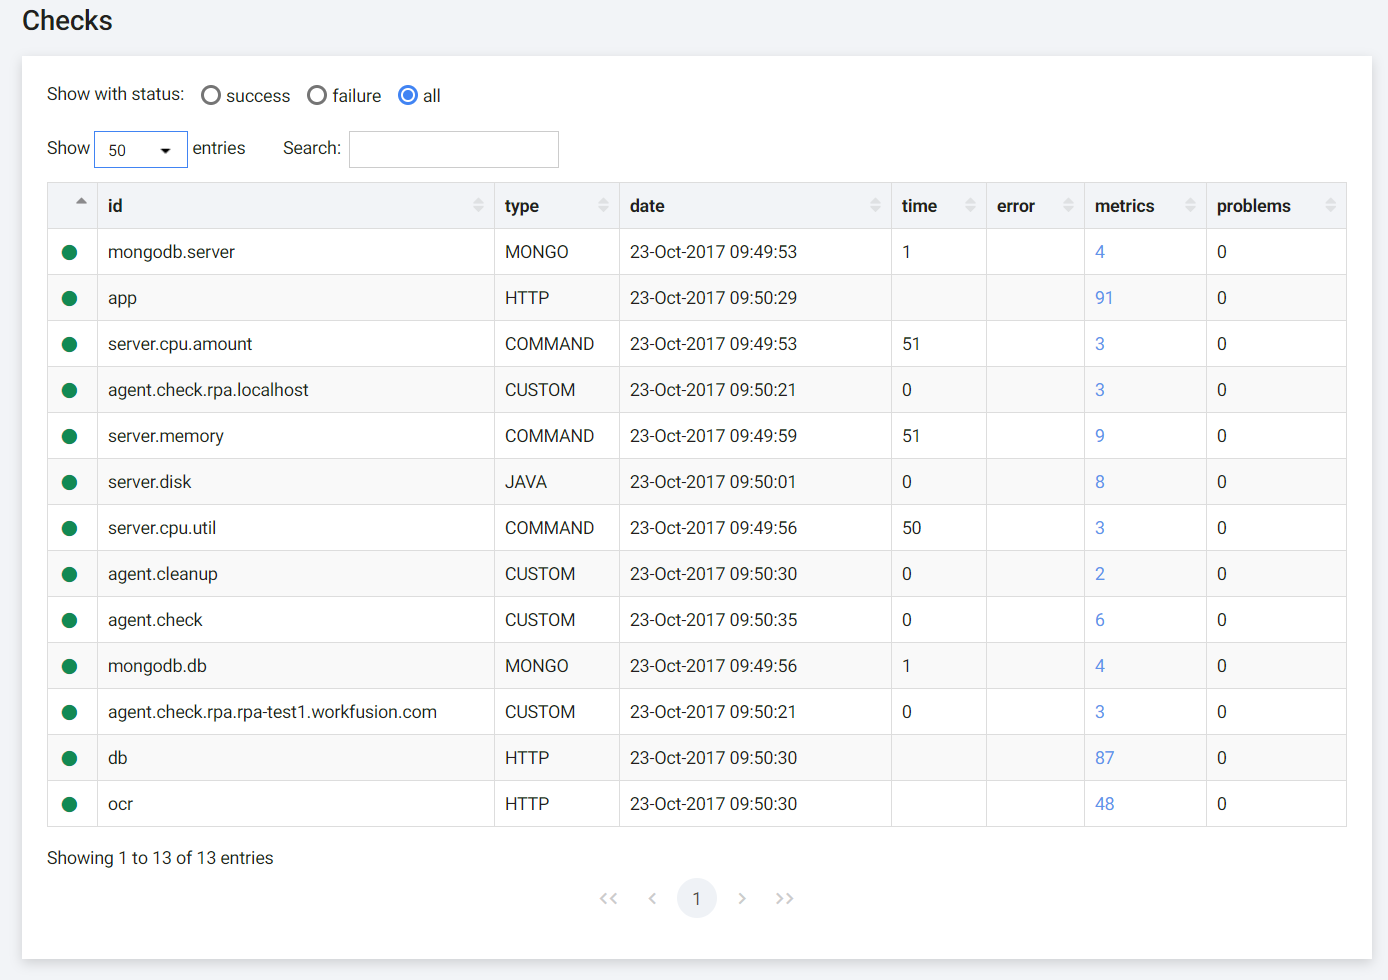
Checks
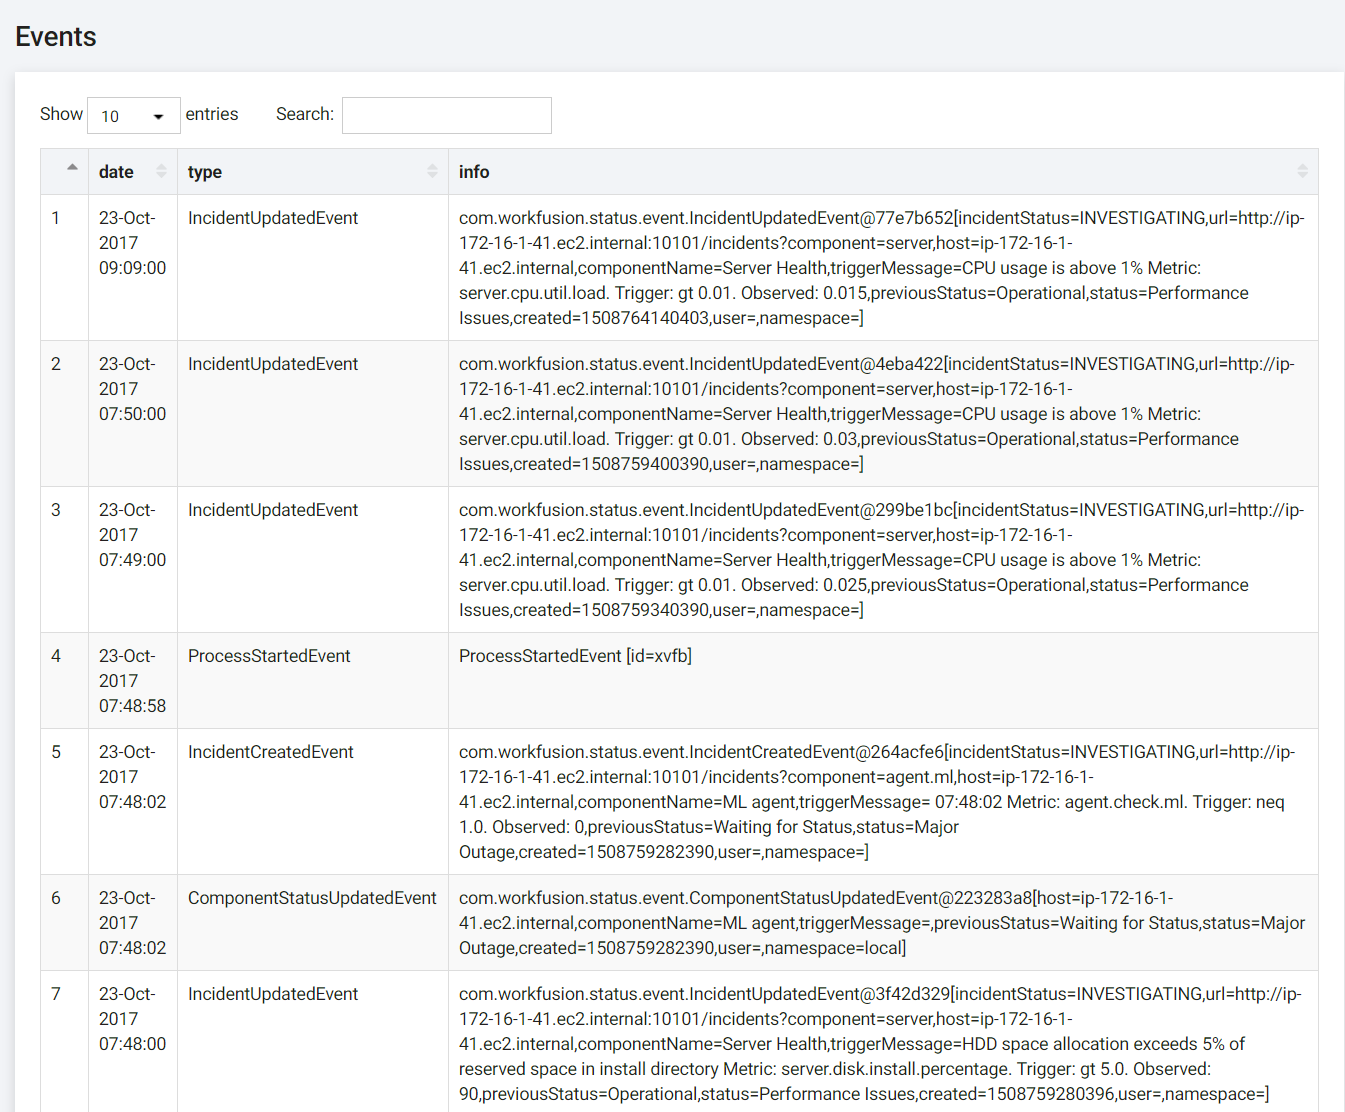
Events
Forecast
For more details, see Platform Monitor Proactive Monitoring.
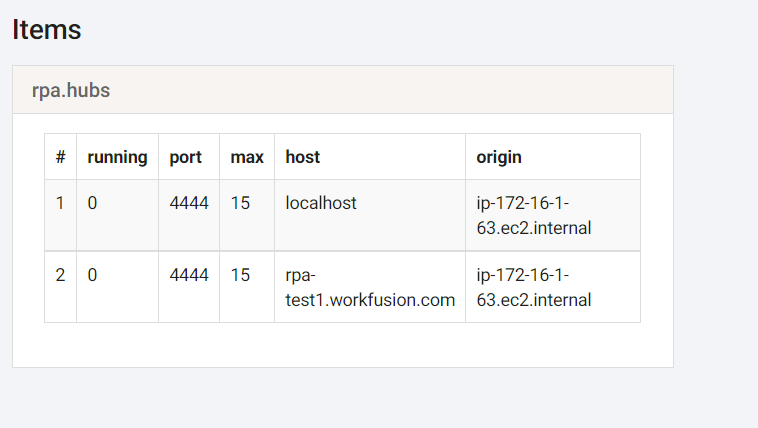
Items
Trend
For more details, see Platform Monitor Proactive Monitoring.
Command Board
A command board provides meand to execute the commands and restart the components.
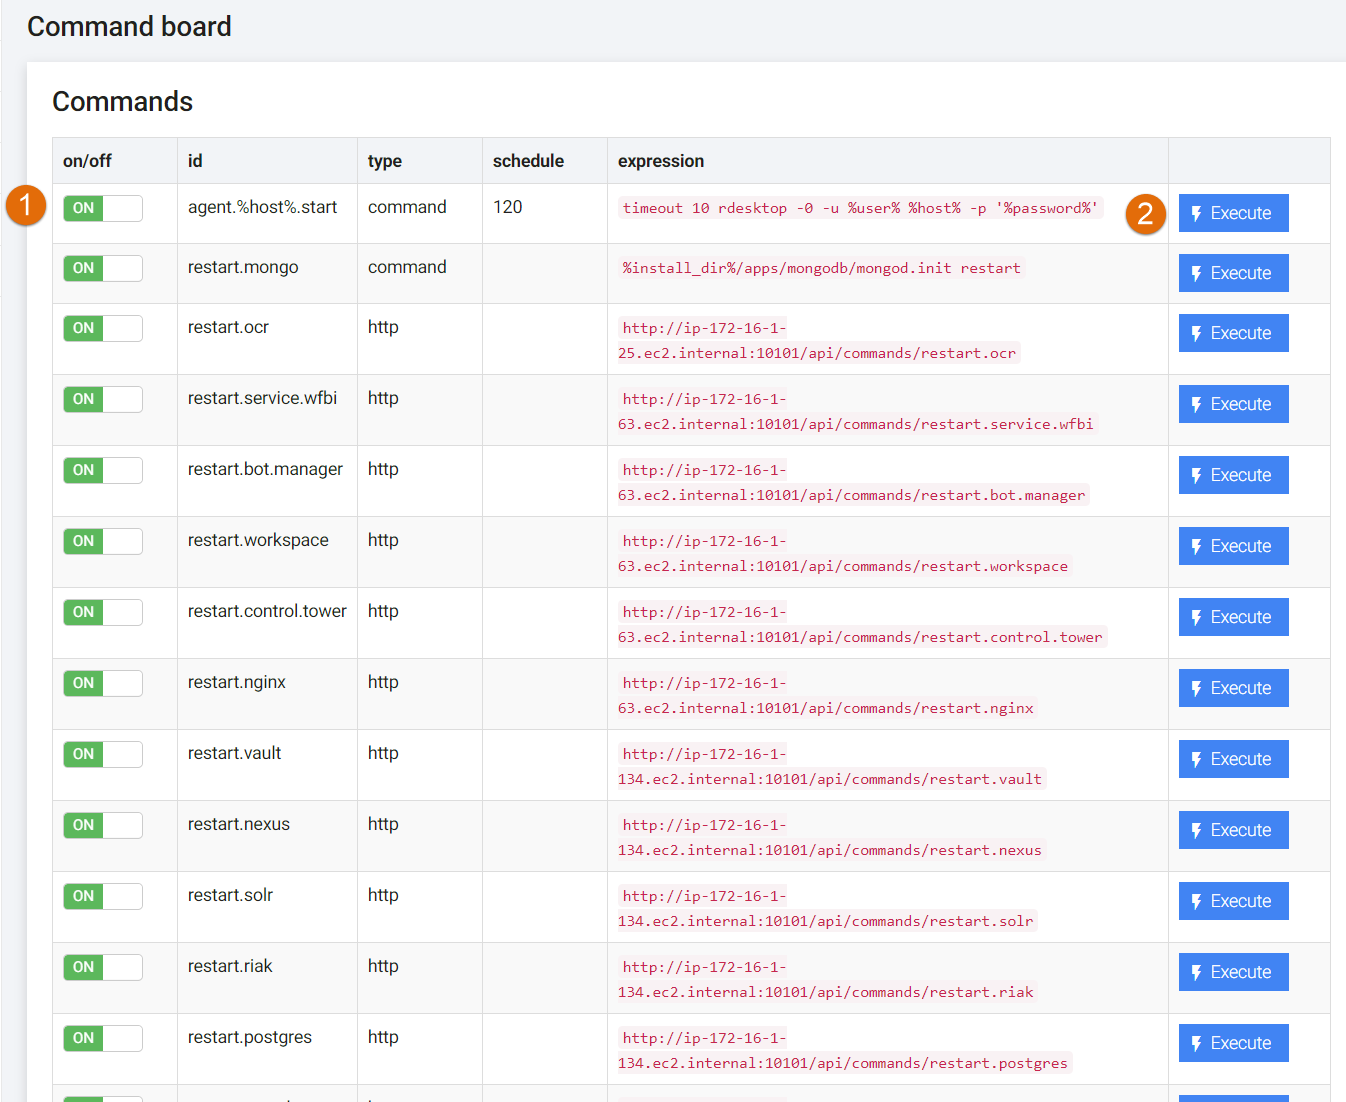
- Choose on or off.
- Click Execute.
Processes
One of Platform Monitor's feature is external process management. This allows controlling process state and lifecycle.
Process Management UI
Go to the Processes tab (if it is not disabled in the configuration).
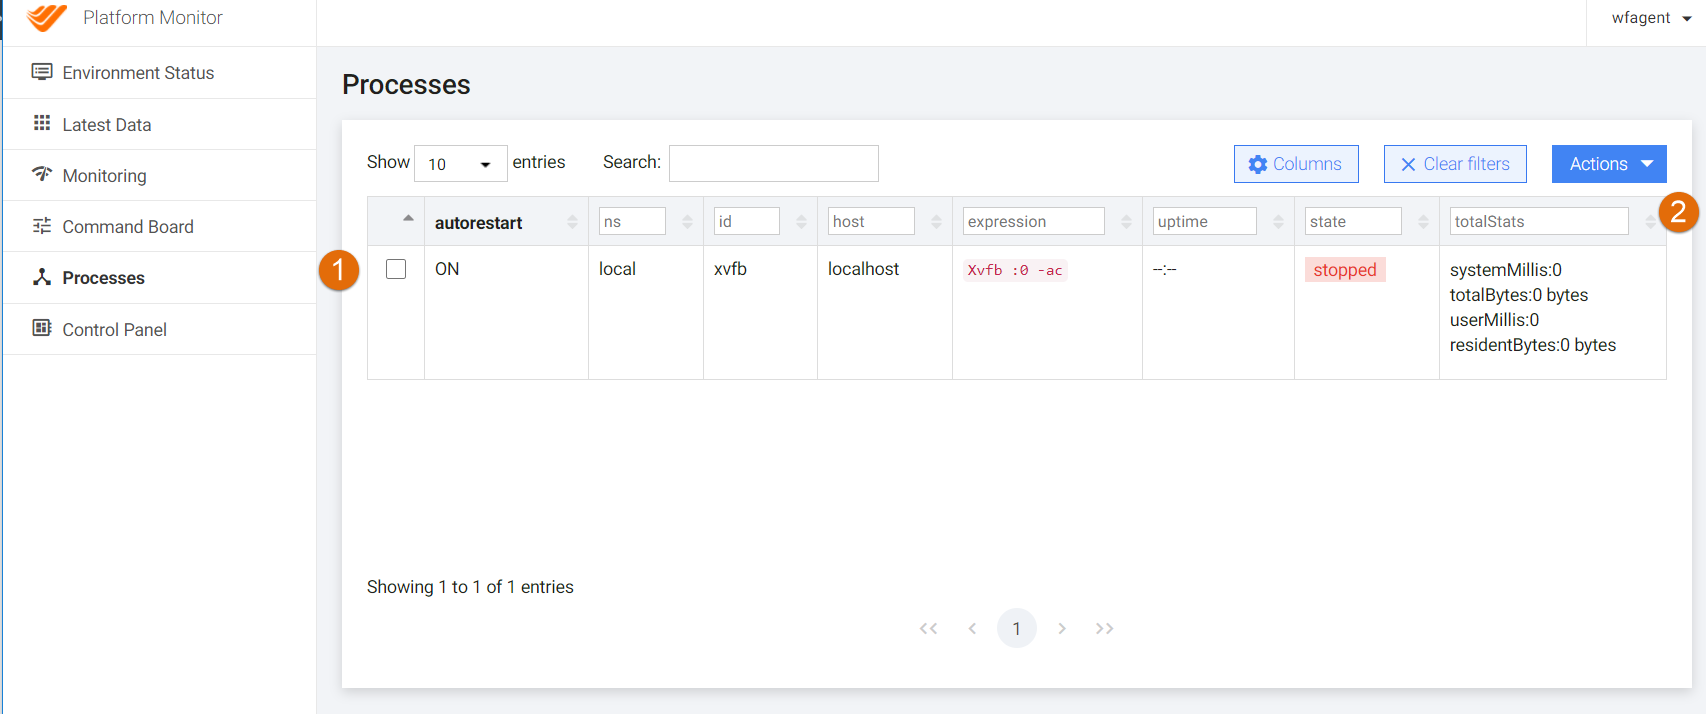
Process columns are as follows:
- Autorestart: OFF means after process stopped it will not be automatically recovered. ON means process will be automatically started if it is in the stopped state.
- Expression: command line that will be executed to spawn process.
- Uptime: time since process started.
- State: either stopped or running.
- TotalStats: process memory and CPU usage.
Manage process
Choose a process.
Choose an action.
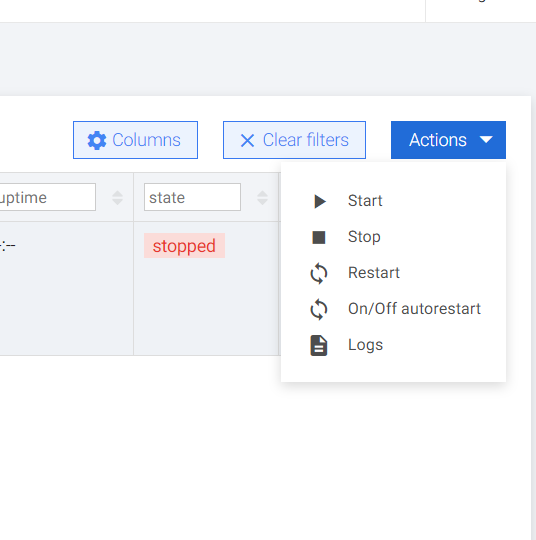
Process actions
These actions allows starting, stopping, or restarting a process.
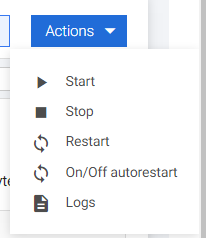
- Start starts the process.
- Stop stops the process.
- Restart restarts the process.
- On/Off autorestart enables/disables autorestart.
- Logs shows logs.
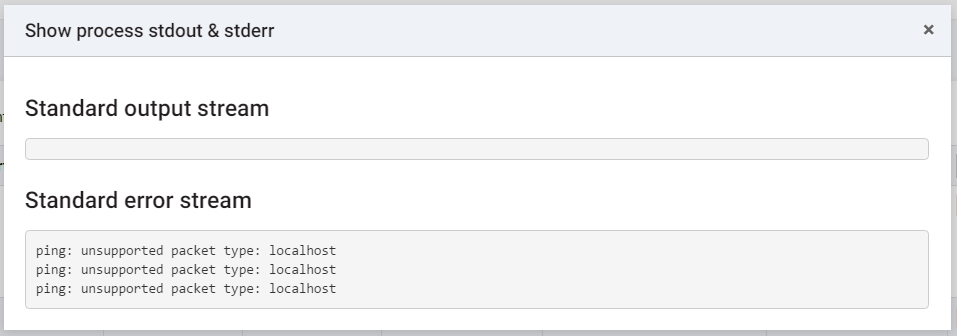
Logs
Logs display standard output and errors if there are any.
Process configuration
Processes can be defined in the main configuration YAML file.
Example:
processes:
  - id: top
    type: command
    expression: top
    autorestart: false
    tag: hub
  - id: pause
    type: command
    expression: ping -t localhost
    autorestart: false
    tag: node
Supported options are as follows:
- id: unique ID of process.
- type: command (system call) or http (web call).
- expression: command to execute for launching process.
- autorestart: true (default) if automatically restore process. A process watchdog will be created.
- tag: list of tags for a process.
- stop: expression to stop a process.
- directory: custom directory from which to execute a process.
- loggerOut: true (default) if collecting standard output stream.
- loggerErr: true (default) if collecting standard error stream.
Process watchdog
Platform Monitors proactively monitors state of each launched process. If autorestart is set to true, all stopped processes will be automatically started.
A process watchdog is cheduled to run every 30 seconds and will analyze all configured processes.
Control panel
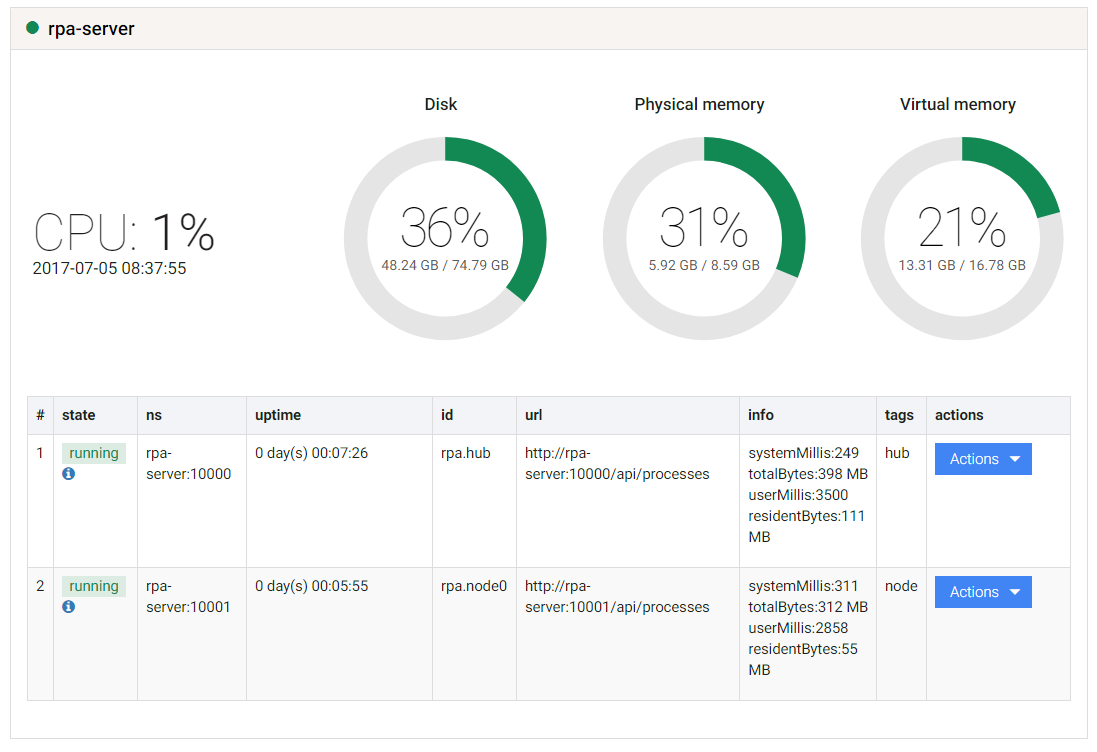
The UI has the following sections and functionality:
- RPA robots overview: instances and robots statistics.
- Each RPA server has a list of processes.
- Process metrics (Uptime/Memory).
- Process actions (Start/Stop/Restart).
- RPA Server metrics (CPU/Memory/Disk/Uptime).
Bot Manager
List of bots.
Bots statistics
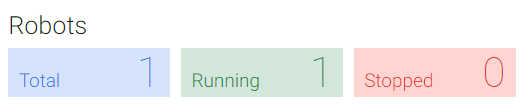
- Robots Total: sum of stopped and running RPA Node processes.
- Robots Running: when RPA Node process is up and running (doesn't reflect whether it is executing a task).
- Robots Stopped: when RPA Node process is crashed or manually stopped.
Instance statistics
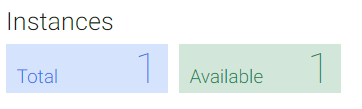
- Instances Total: all RPA Servers configured in RPA Manager
- Instances Available: RPA Servers which are accessible through Platform Monitor
RPA Server
Process actions
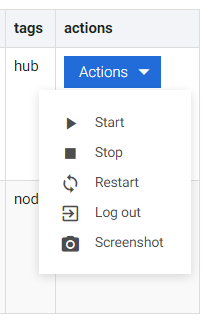
- Start launches a selected process.
- Stop stops a selected process.
- Restart stops and starts a selected process.
- Screenshot takes a screenshot (works for active sessions only).
- Logout executes a logout command (the session closes and all processes are stopped).
Metrics description
This guide describes what kind of checks are executed in APM against the WorkFusion components to get environment health and performance metrics.
Server
| Check in APM | Source | Description | Metrics |
|---|---|---|---|
| server.disk | JAVA | Check disk statistics for specified directory |
|
| server.memory | COMMAND | Check memory statistics using external command |
|
| server.cpu.util | COMMAND | Gets cpu utilization info. Provides an average value (from 0.0 to 1.0) of CPU's load over the last minute which takes into account available cores. |
|
APP
| Check in APM | Source | Description | Metrics |
|---|---|---|---|
| wf.login | HTTP | Open WorkFusion Login page |
|
| ws.dashboard | HTTP | Open WorkSpace Index page |
|
DB
| Check in APM | Source | Description | Metrics |
|---|---|---|---|
| riak.stats | HTTP | Open Riak stats page and parse JSON |
|
riak.tcp stanchion.tcp riakcs.tcp |
TCP | Checks that specified ports are in LISTENING mode |
|
| s3cmd.ls | COMMAND | Execute s3cmd command to list available buckets. Checks configuration of s3cmd and availability of Riak services |
|
| solr | HTTP | Request Solr admin information API and parse JSON |
|
| mysql.query1 | SQL | Run MySQL query to retrieve database name |
|
| mysql.query2 | SQL | Run MySQL query to retrieve version |
|
| postgres.query1 | SQL | Run Postgres query to retrieve database name |
|
| postgres.query2 | SQL | Run Postgres query to retrieve version |
|
| mongodb.db | MONGO | Run MongoDB query to retreive database statistics |
|
| mongodb.server | MONGO | Run MongoDB query to retrieve server statistics |
|
ML
| Check in APM | Source | Description | Metrics |
|---|---|---|---|
| gateway.api | HTTP | Request Gateway API on currently available hypermodels |
|
| gateway.info | HTTP | Request Gateway API about deployed version |
|
| scaling.api | HTTP | Request Scaling API on currently available hypermodels |
|
| scaling.info | HTTP | Request Scaling API about deployed version |
|
| duccadapter.info | HTTP | Request Duccadapter API about deployed version |
|
| emulator.api | HTTP | Request Emulator API - catalog endpoint |
|
| emulator.info | HTTP | Request Emulator API about deployed version |
|
| rabbitmq.api | HTTP | Request RabbitMQ overview API |
|
| ducc.reservations | HTTP | Open DUCC reservations page |
|
OCR
| Check in APM | Source | Description | Metrics |
|---|---|---|---|
| ocr.rest.api | HTTP | Request OCR Rest API entrypoint |
|
| ocr.rest.summary | HTTP | Request OCR Rest API - summary endpoint |
|
| ocr.rest.info | HTTP | Request OCR Rest API about deployed version |
|
| ocr.rest.tasks | HTTP | Request OCR Rest API about queued tasks |
|
| ocr.license | HTTP | Request OCR Rest API about license page count |
|
RPA
| Check in APM | Source | Description | Metrics |
|---|---|---|---|
| rpa.ct.hub.%rpa_hub_hostname%.%rpa_hub_port% | HTTP | Request RPA Hub API about session statistics |
|