
Using Elastic monitoring
Monitoring solution contains the following components:
Kibana with system performance dashboards
Elasticsearch for storing metrics data
note
There is no Authentication method enabled for Kibana dashboards.
Monitoring dashboards are available in the Kibana UI. Find the UI by visiting https://apm.example.com/kibana location.
On the Dashboard tab you will find all preconfigured dashboards.
Metricbeat System Overview
The dashboard contains brief summary regarding all configured hosts:
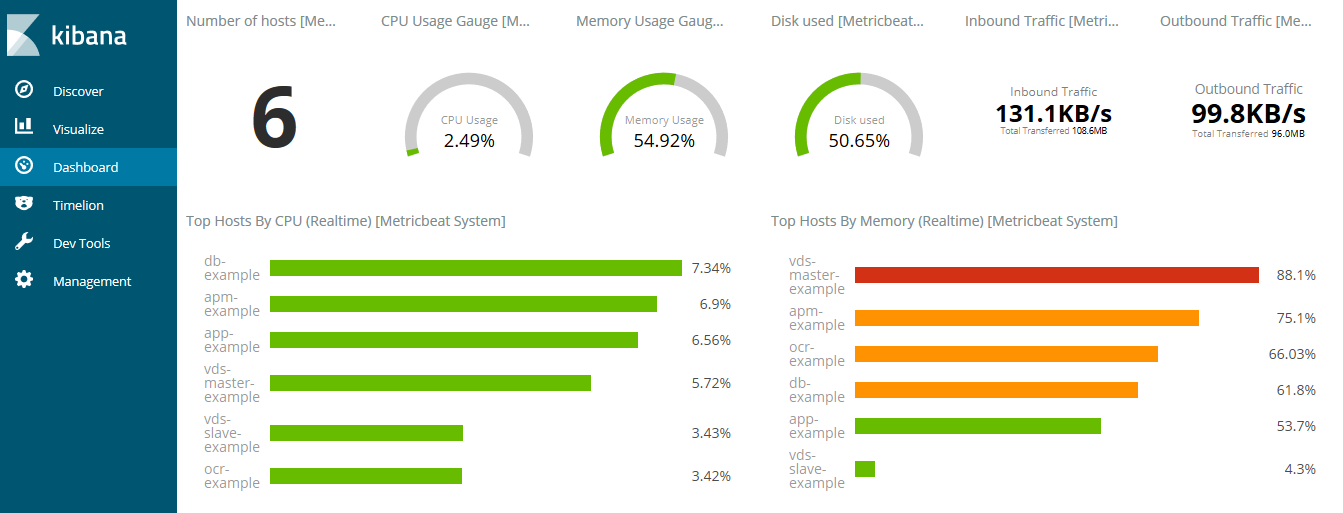
Click the desired host to open the Host overview dashboard page with detailed information regarding a respective instance.
Metricbeat System Host Overview and Metricbeat Windows Services
The dashboard contains detailed time-series information per the host:
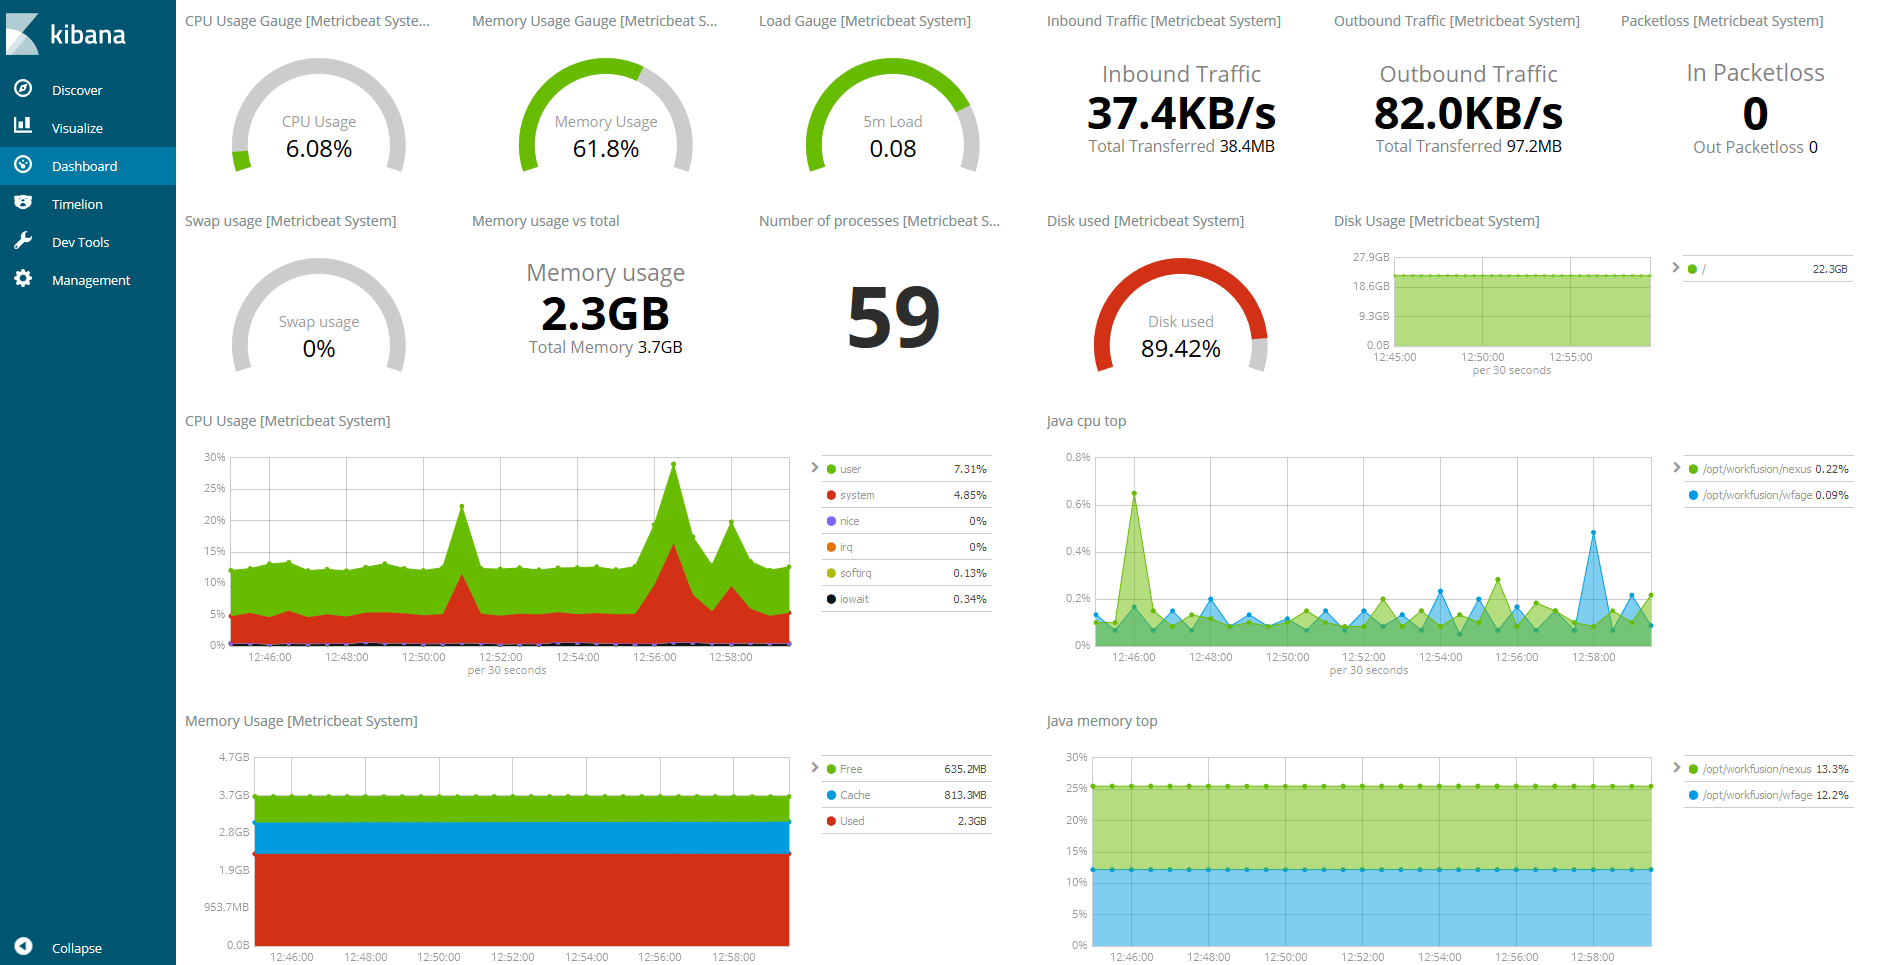
The current release provides information regarding Linux hosts only.