
Using Tableau. End-to-end SSI audit chart setup example
Goals
The guide describes the usage of the WorkFusion Analytics Desktop + WorkFusion Analytics Server + WorkFusion application integration. You can explore the end-to-end usage process based on simple Area Charts setup for one PostgreSQL table. What we wish to visualize: how the quantity of processed HUMAN tasks versus AUTOMATION tasks changes in the course of time.
WorkFusion Analytics Desktop
Prior to Begin
- Install WorkFusion Analytics Desktop on your local machine.
- Obtain access to the database on the environment where you'll deploy your chart. In this example, we need credentials to the wf_datastore PostgreSQL database. Alternatively you can work with your local file (text, Excel, and so on).
- Obtain access to the WorkFusion Analytics Server integrated with the environment where you'll deploy your chart.
Working with WorkFusion Analytics Desktop
Connecting to the DB
Launch the WorkFusion Analytics Desktop.
In the top left corner, click Connect to Data > PostgreSQL and enter the DB credentials.
If you cannot connect to your DB, try to install the appropriate DB drivers (http://www.WorkFusion Analytics.com/support/drivers).
Now, you can see the tables of your database. Drag-and-drop the ds_SSI_AUDIT_TRAIL table into the white area.
Click the Update Now button. Now, you see actual data from your table.
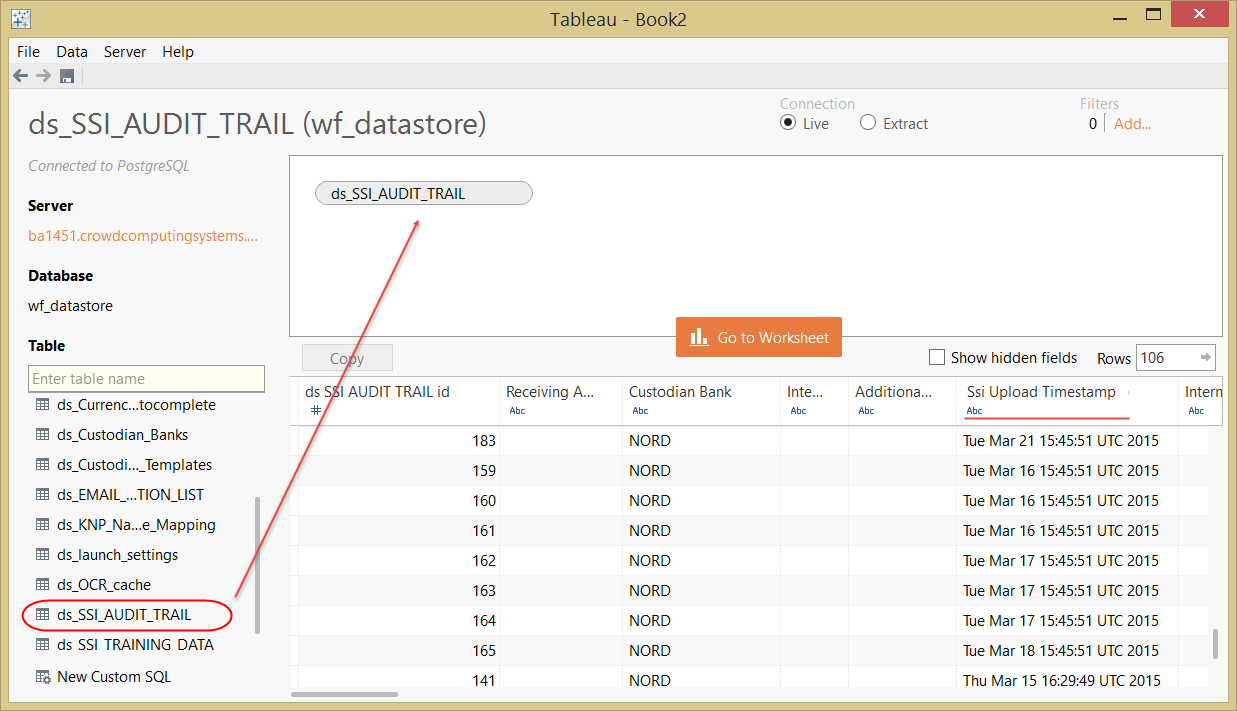
In this example, it's important to change the type of the Ssi Upload Timestamp column from String to Date & time to be able to take advantage of WorkFusion Analytics Date features.
Now, we are done with data source setup and can proceed to the chart visual editor. Click the Go to Worksheet button in the center of the window.
Worksheet setup
The Worksheet appears and you see the main working areas:
a. Dimensions/Measures b. Pages/Filters/Marks c. Chart Preview Area d. Columns/Rows e. Chart Type (Show Me)
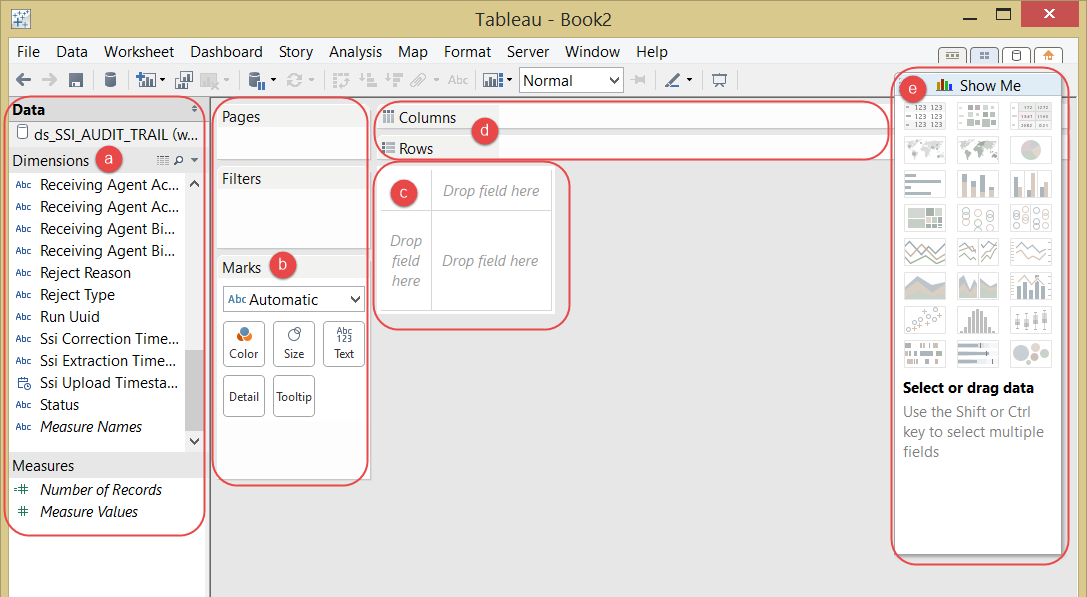
Drag-and-drop the following elements:
- Dimensions > Ssi Upload Timestamp to the Columns
- Measures > Number of Records to the Rows
In the Columns (d) area, right-click the Ssi Upload Timestamp element and select the Day option.
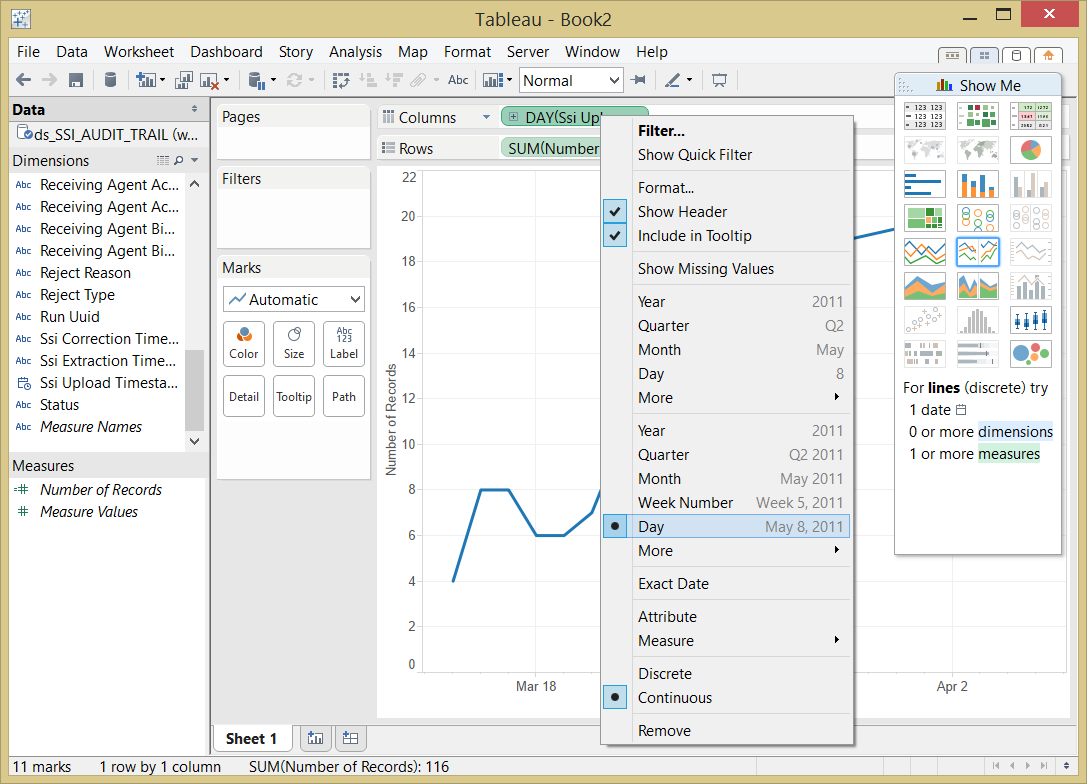
In the Marks (b) toolbox, select the Area type. The area under the chart will be filled with color.
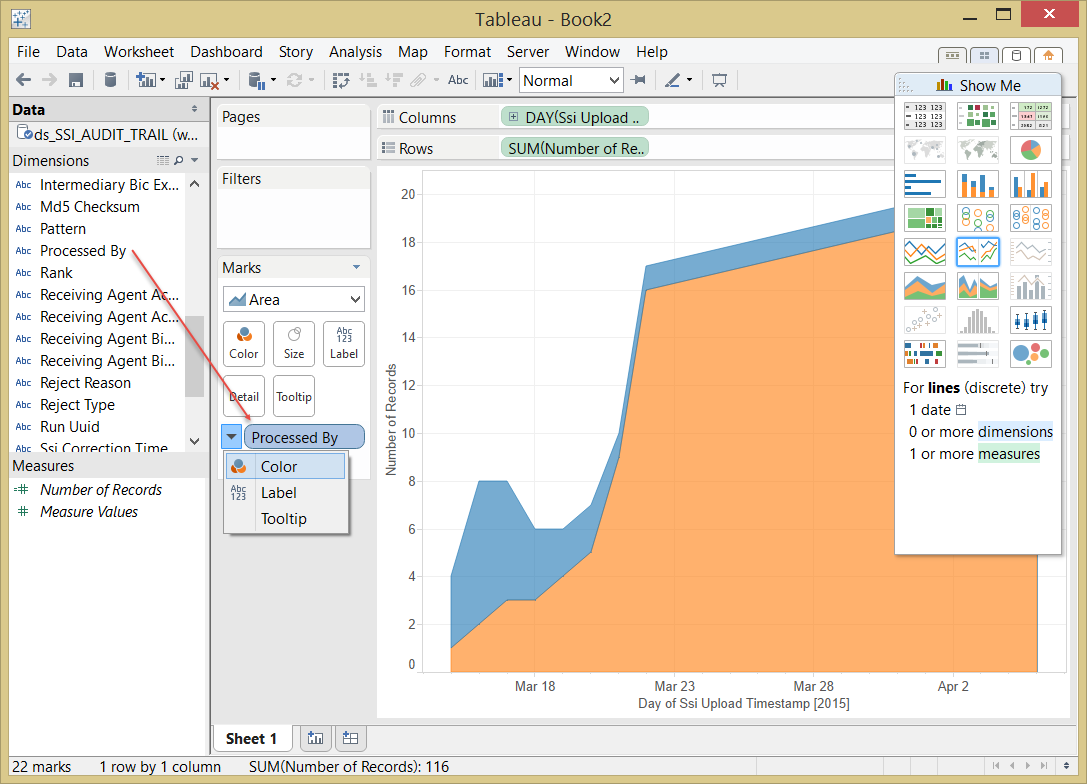
Now, we wish to add chart differentiation by the Processed By column, so we drag-and-drop the Processed By column from the Dimensions (a) to the bottom of the Marks (b) toolbox. Select Color from the context menu left side of it.
Dashboard setup
The Chart is ready and we can polish it with some filters.
Create a Dashboard for the chart. In the main menu, select Dashboard > New Dashboard.
On the Dashboard view, drag-and-drop your chart from the left menu to the design area. The Chart will appear.
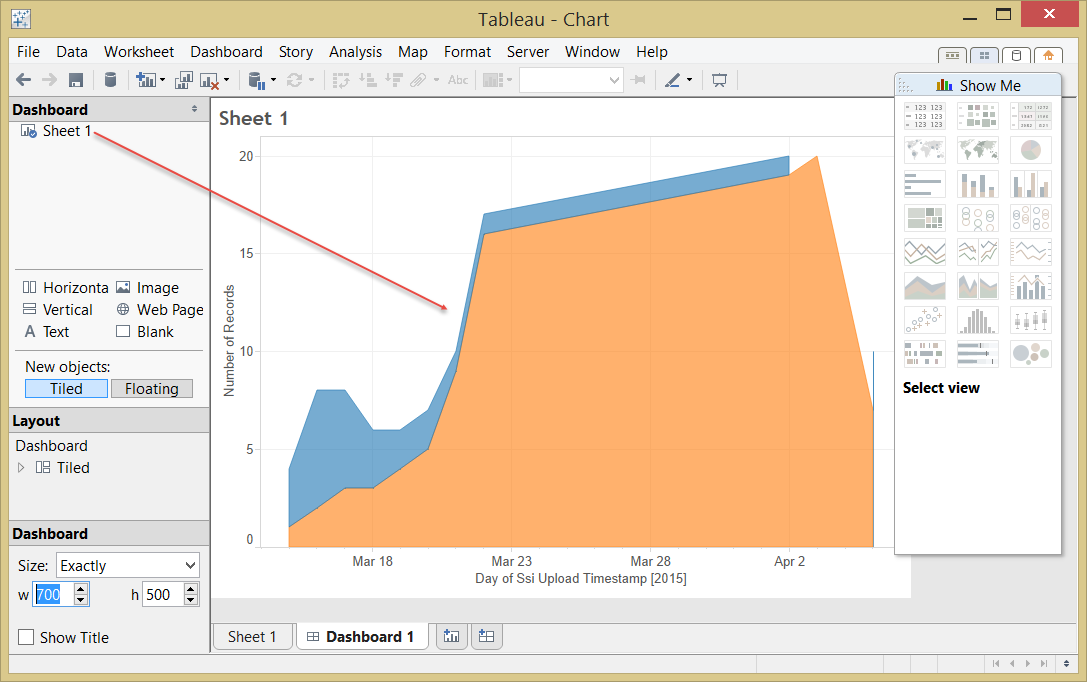
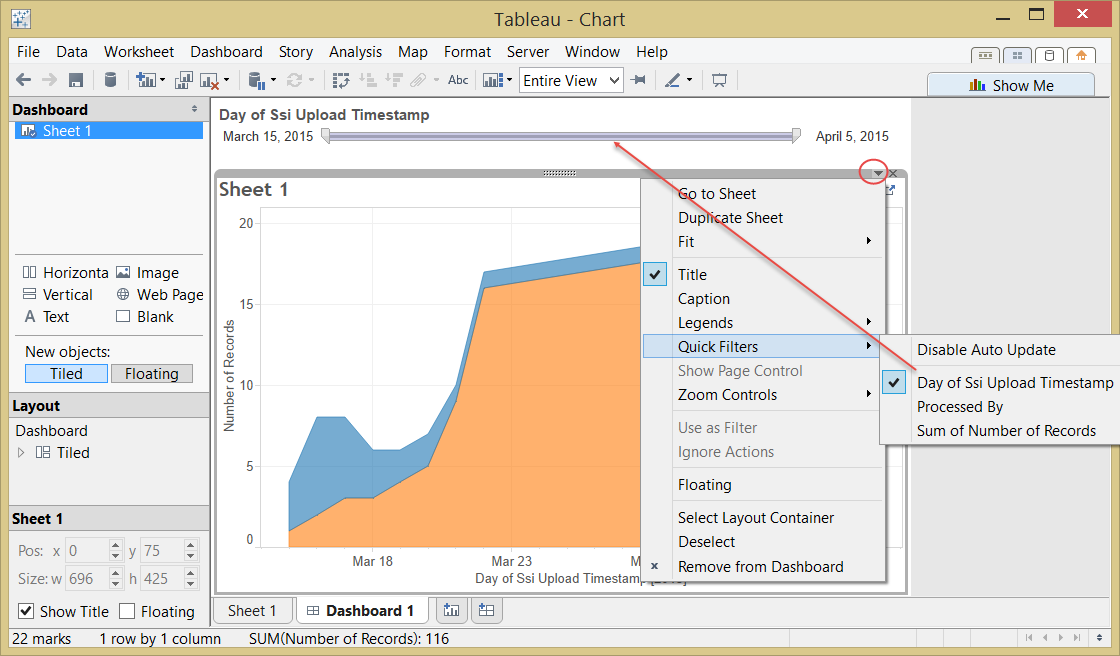
From the Chart context menu, we can add filter by Ssi Upload Timestamp and play with the position of filter and the legend.
It's important to meet markup guides for charts in the WF application. Change the Size as shown below.
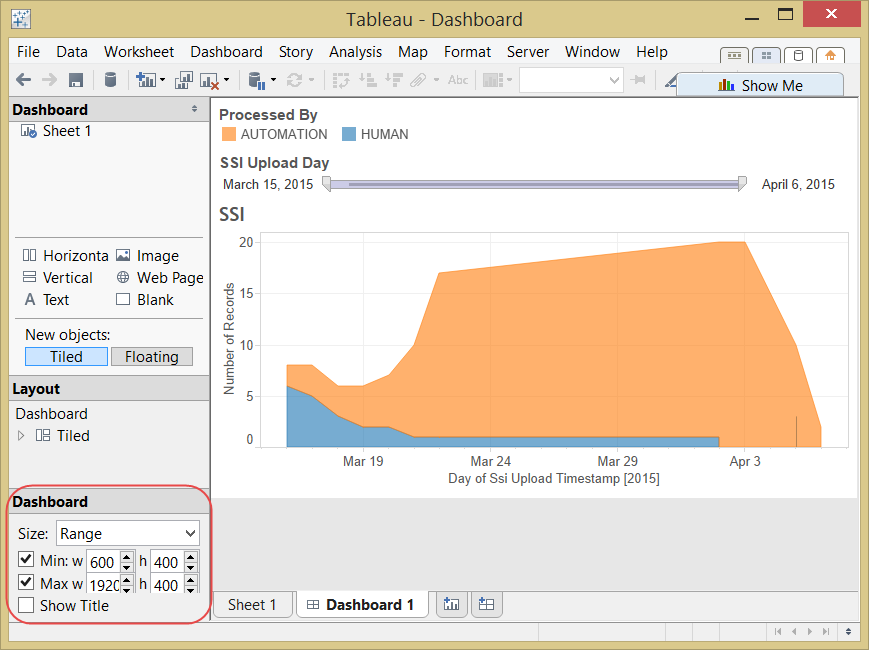
Change the locale: File > Workbook Locale > English (United States). You can edit chart colors, fonts, labels, and so on.
Deployment
Now, we are ready to deploy the Dashboard on the WorkFusion Analytics Server.
Connect to the server by selecting Server > Sign In (the main menu) and enter the server name.
To start the deployment, select Server > Publish Workbook and select your site from the drop-down.
Give a name to your Workbook for the WorkFusion Analytics Server.
It's important to use the
_custompostfix in name, to meet WF Dashboard configuration requirements. The name should not start with a digit.The name of project should be the same as name of instance.
In the Views to Share panel, check only the SSI Dashboard.
Press the Authentication button at the bottom and select Embedded password to let users see the chart in WF without entering the WorkFusion Analytics Server password.
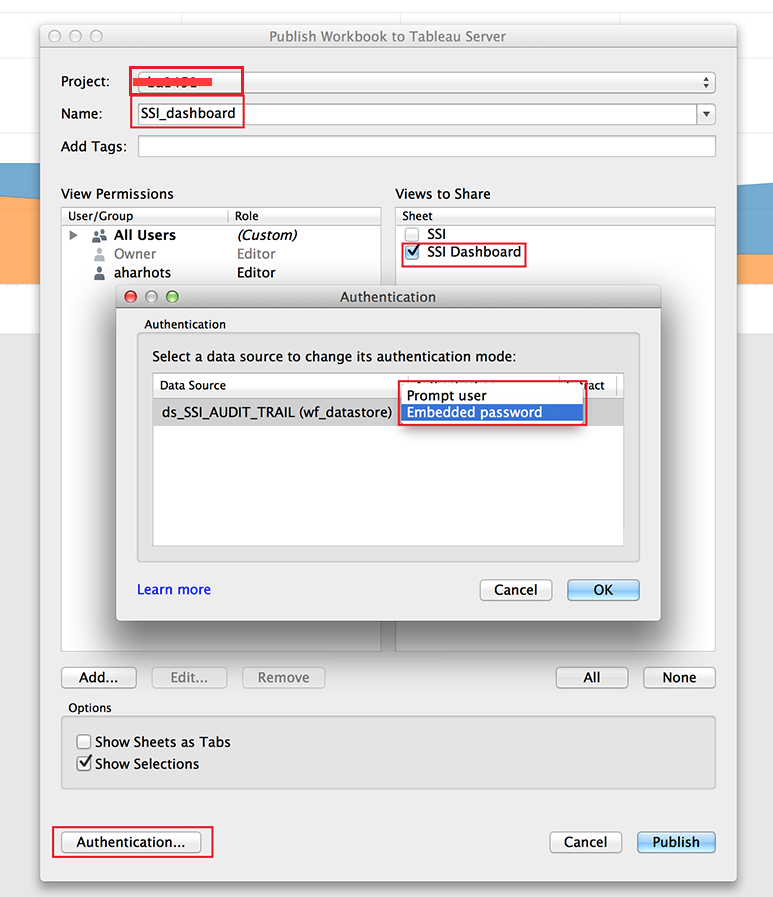
Click the Publish button. The confirmation dialog with preview will appear.
WorkFusion Analytics Server
To manage the deployed chart, you need to sign-in to the WorkFusion Analytics Server web Admin (with the same credentials as connected in WorkFusion Analytics Desktop to WorkFusion Analytics Server). Here you can Delete and change Permissions to the Workbook.
WF Application Dashboard
The published chart will appear on the WorkFusion Analytics Custom page.