View Business Process results
The article details how to find Business Process (BP) results, events, and errors.
See BP events and errors
To find out about the events (bot or user actions) or errors during a BP execution, refer to the BP event log. To access it from the Results tab, click the event log icon.
The icon is red if the log includes errors. Otherwise, the icon is greyed out.
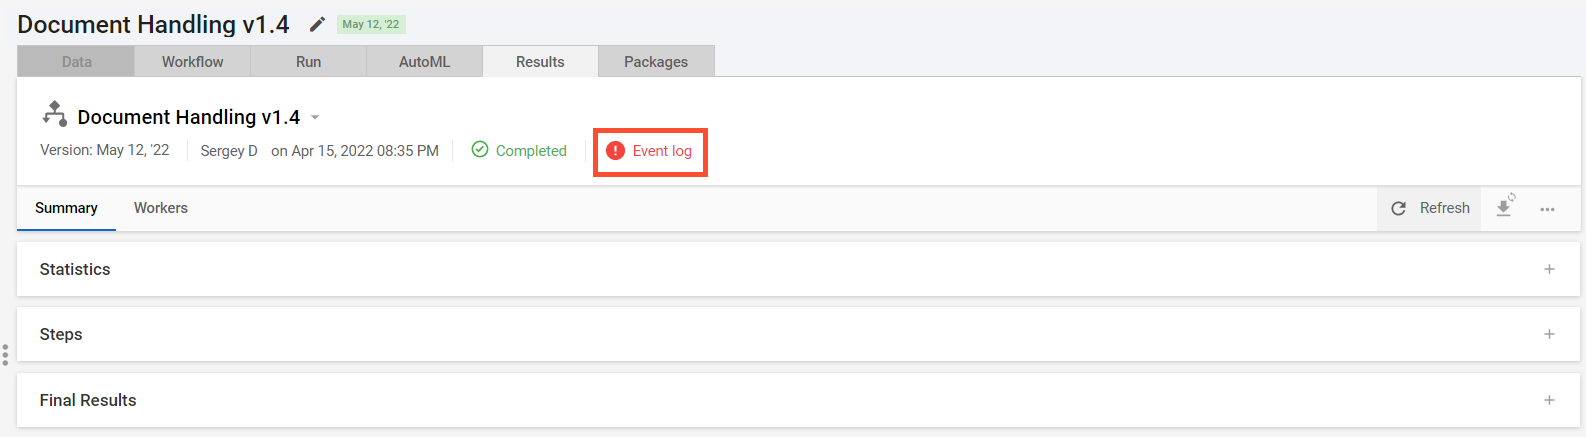
Alternatively, you can access the event log and errors from the BP list by clicking the event log icon:
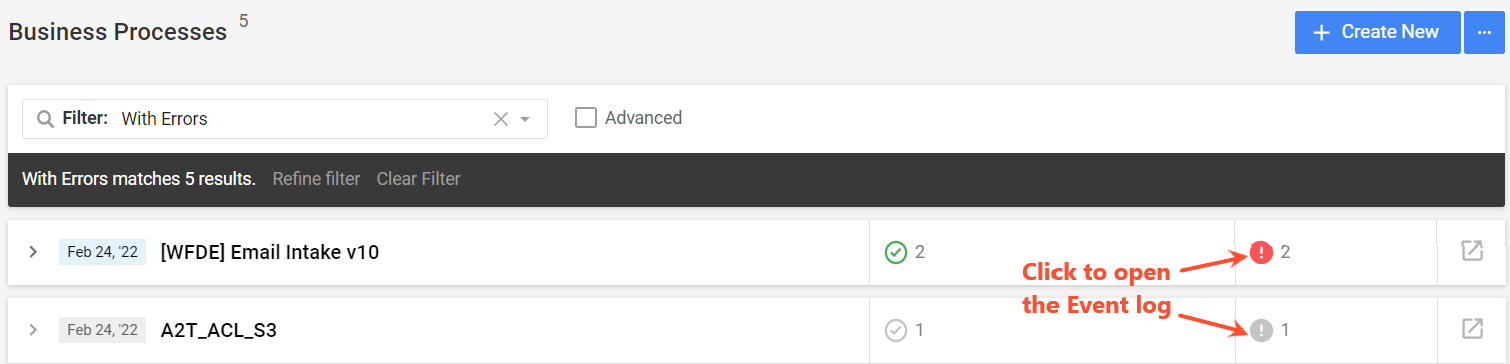
As you click the icon from the BP list or on the Results tab, the Event log popup appears:
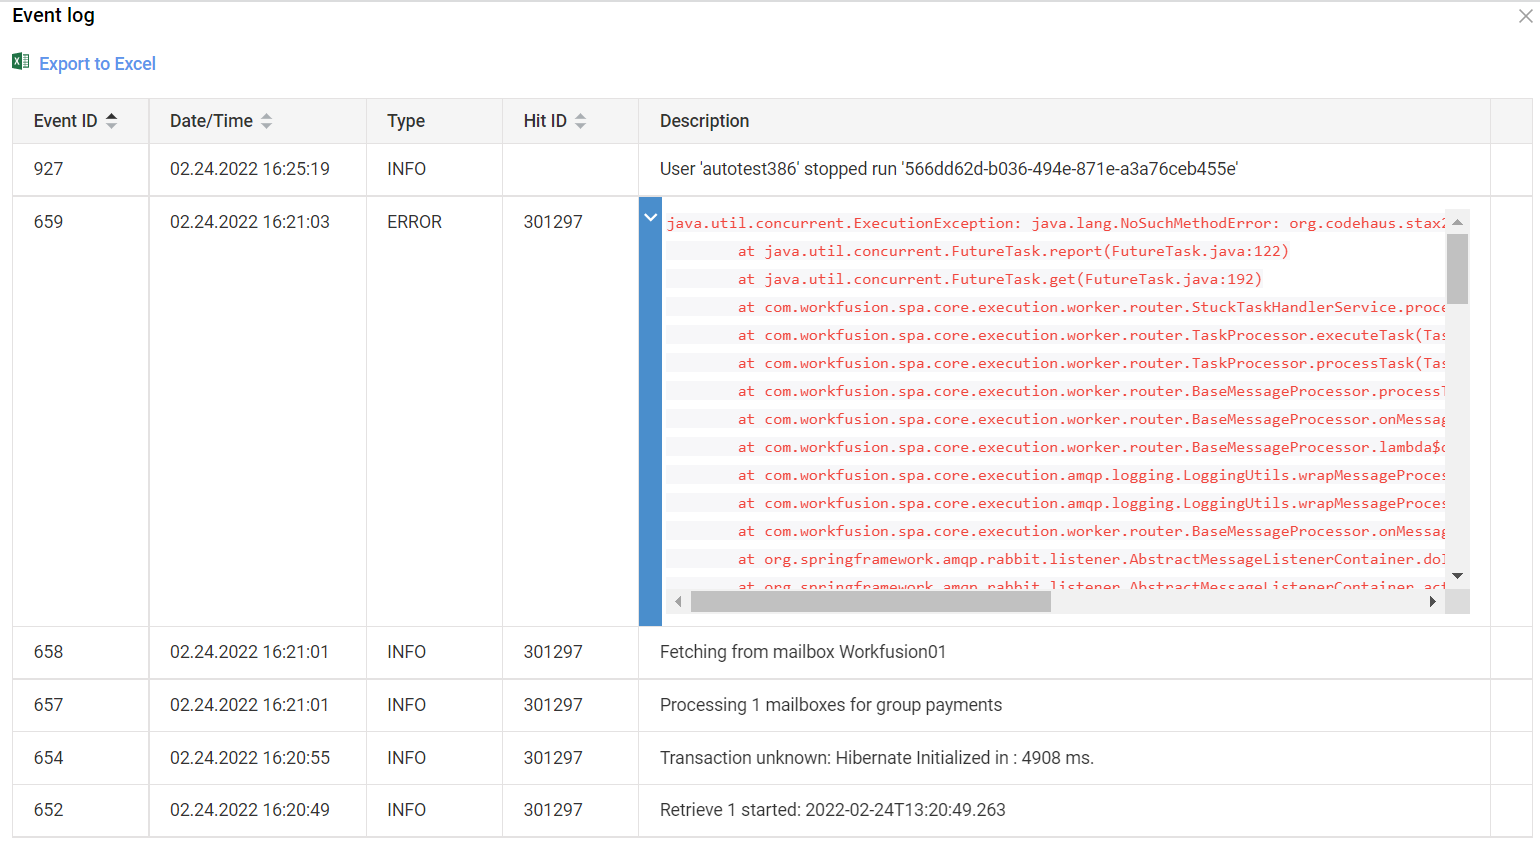
When a user logs into a Control Tower instance using a time zone different from the Greenwich Mean Time (GMT), the Business Process event log and any exported event log sheets are in GMT, irrespective of the user time zone.
For more information about BP event logs, read the View logs and repair Business Processes topic.
View BP results
The Results tab provides a comprehensive overview of a Business Process, in particular:
- BP structure
- Instance-related data
- Statistics for every BP element
- Failed elements in the BP and errors that caused the failure
- Execution results of individual tasks inside the BP
- Worker names and assignment-related information for individual Manual Tasks
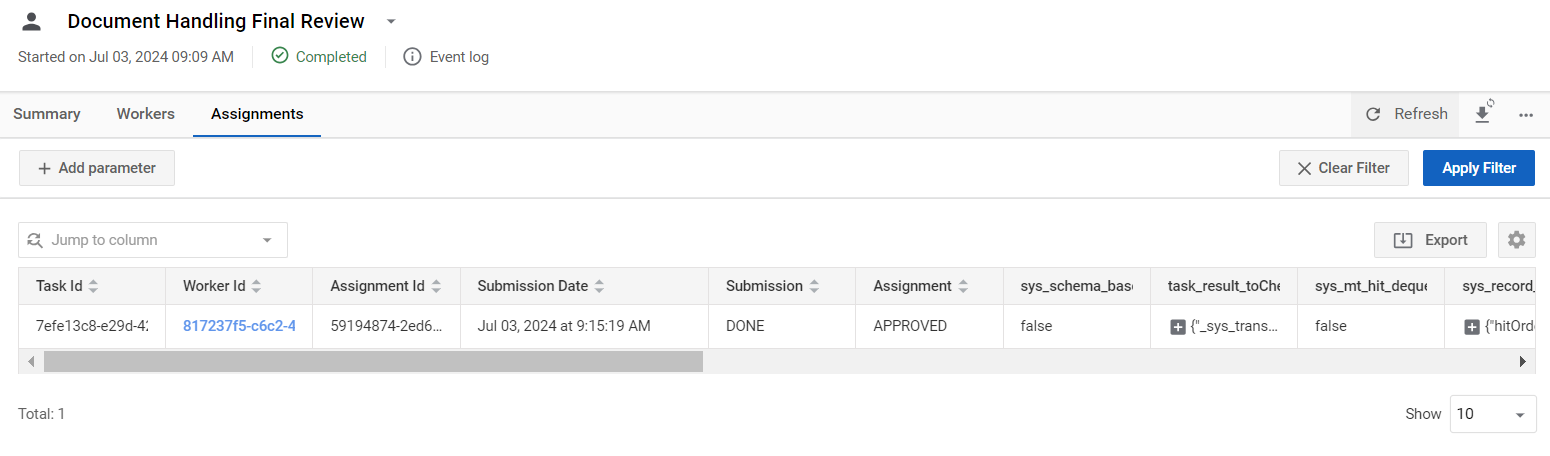
The Results tab has two areas:
- Information header.
- Tab view that can have different sections, depending on the BP element selected in the Information header.
The appearance of some tabs can differ depending on user permissions and licenses.
Information header
The information header comprises the following elements:

The information header comprises the following elements:
1. Instance menu
The drop-down menu provides information about the BP structure. Choose an individual instance from the tree structure to display the associated Results tab.
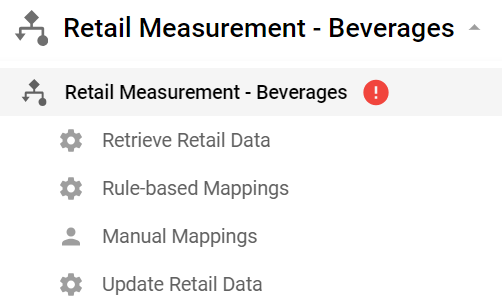
Instances are displayed in the order of execution, with the main BP as the first option. The current instance is displayed in bold. The icon to the left of the instance name denotes its type or status:
| Icon | Description |
|---|---|
 | Business Process or sub-process |
 | Bot Task |
 | Manual Task |
 | Instance execution failed with error |
To expand the components of the sub-process, select the arrow (>) near its title:

2. Instance metadata

Instance metadata comprises the following:
- Version
- Author and creation date
- Execution status
- Event log
- Automation status
- Business Process tags
The exact layout depends on the selected instance type and user licenses. To open the full log event, click the Event log icon.
Tab view
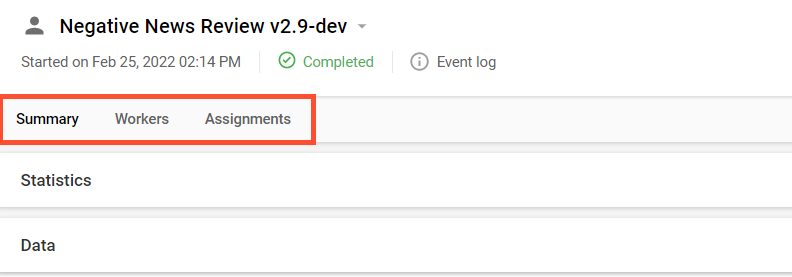
The exact available tabs depend on the Instance menu selection:
- For sub-processes, Bot Tasks, and BPs with only Bot Tasks, only the Summary tab is available.
- For BPs with both Manual and Bot Tasks, available tabs include Summary and Workers. Mind that the Workers tab is displayed if the user has the MANAGE_WORKERS permission.
- For Manual Tasks, available tabs are Summary, Workers, and Assignments.
Select one of the tabs to view specific information.
Summary
The Summary tab displays up to three blocks:
Statistics
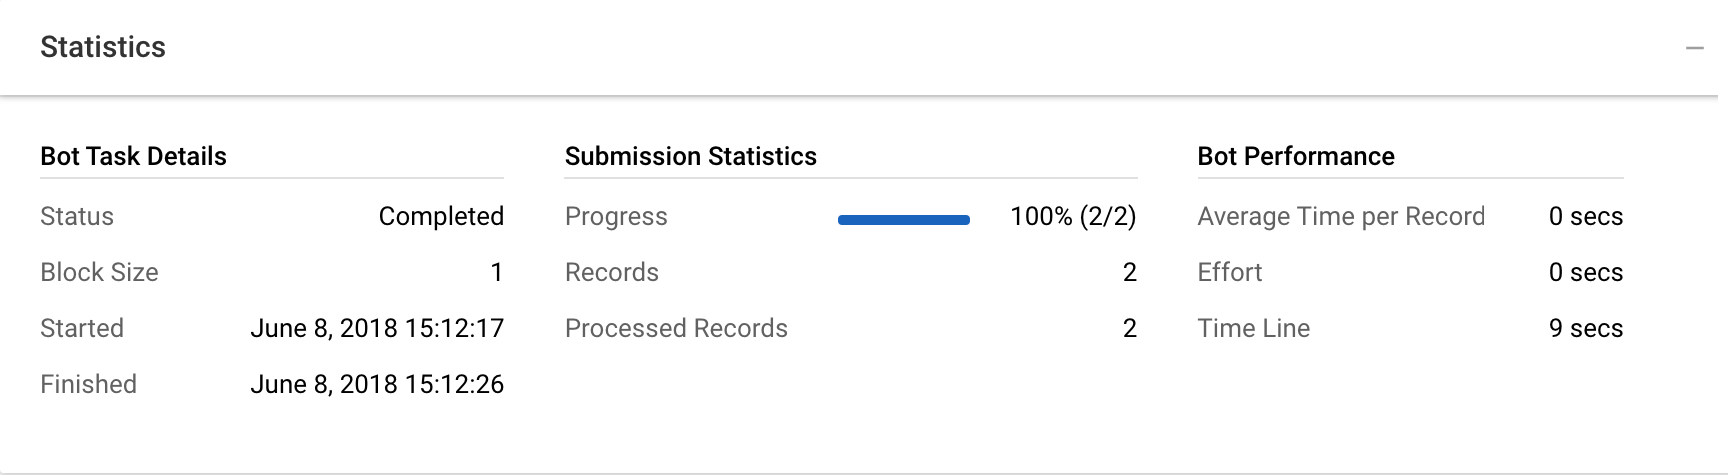
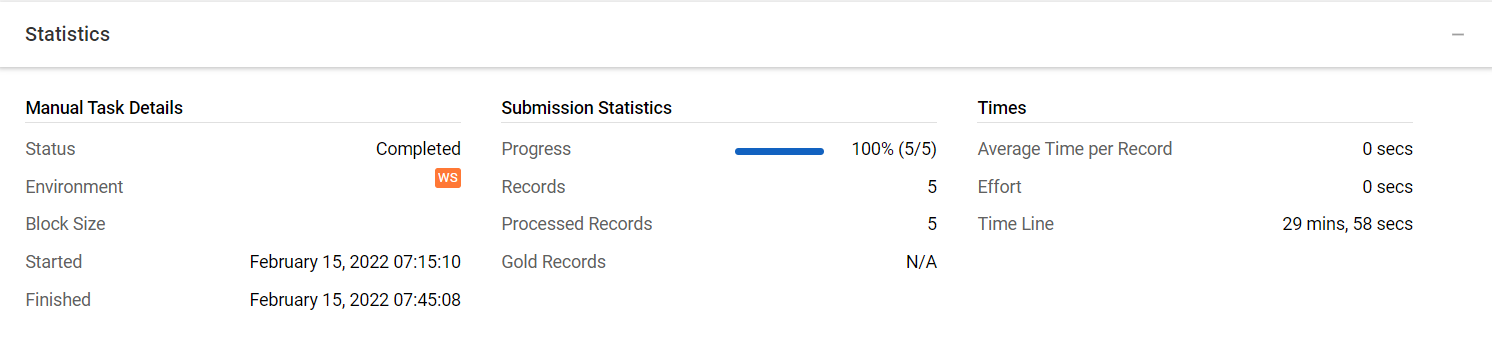
The block is shown for any instance type. Its appearance depends on the type of the selected instance.
Sample statistics block for Bot Task:
Sample statistics block for Manual Task:
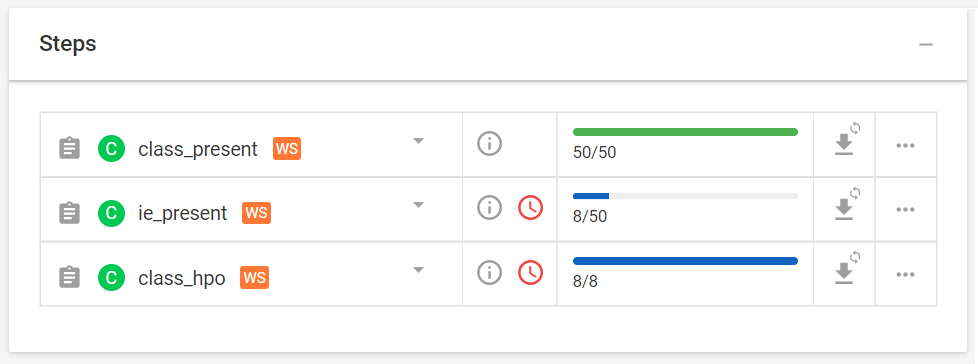
Steps
The block is shown for compound instances—BPs or sub-processes. It displays an instance structure and enables you to perform specific actions with the instance: view statistics and full event log, generate a snapshot, and so on. The actions a user can select depend on the instance type and license.
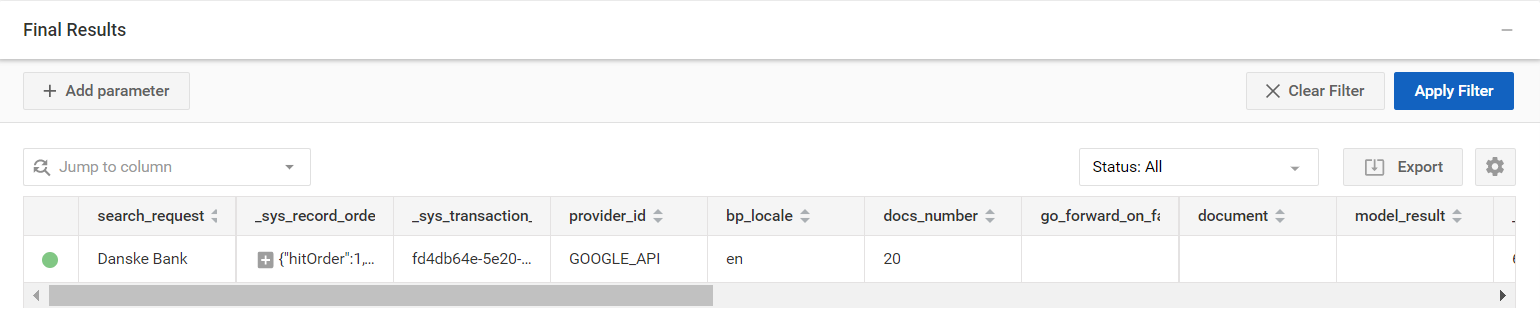
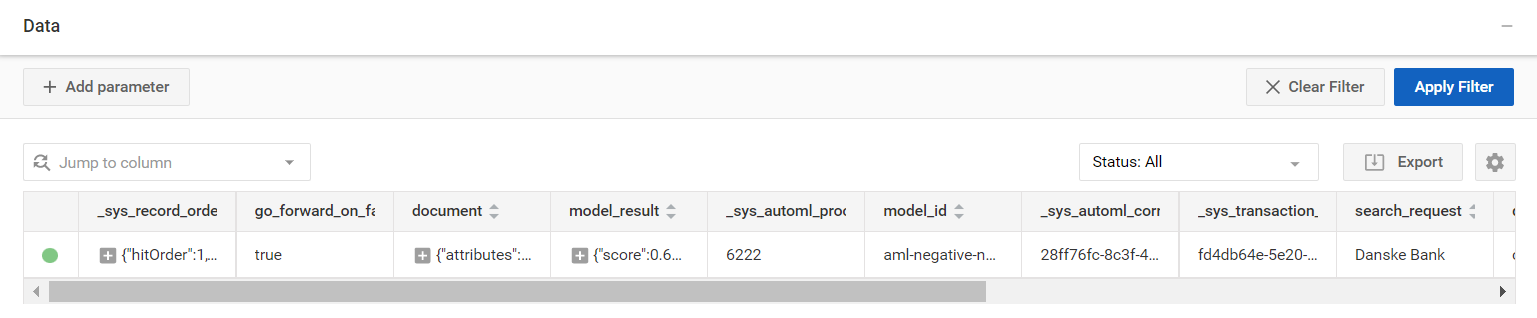
Data or Final Results
You see either Data or Final Results, depending on the instance type you selected. The Final Results block is displayed for a BP, provided at least one record passed through all its steps. This block shows each record in a selected instance.
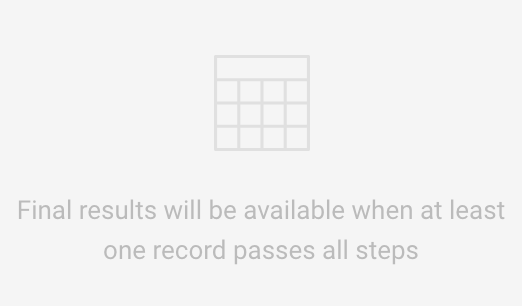
If no record has passed through the BP yet, you see the following message:
The Data block is displayed for Manual or Bot Tasks.
To customize the look of the Data or Final results block tables, use Table tools.
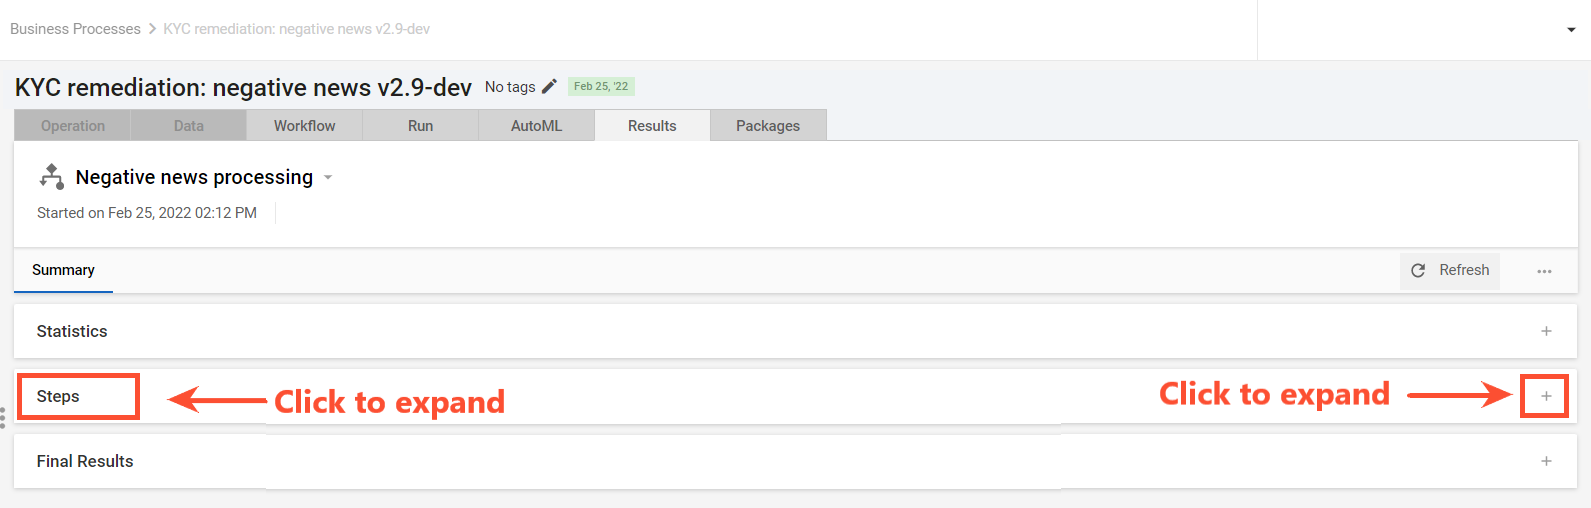
To expand a block, select its header or click the plus (+) sign. To update the view, click Refresh.
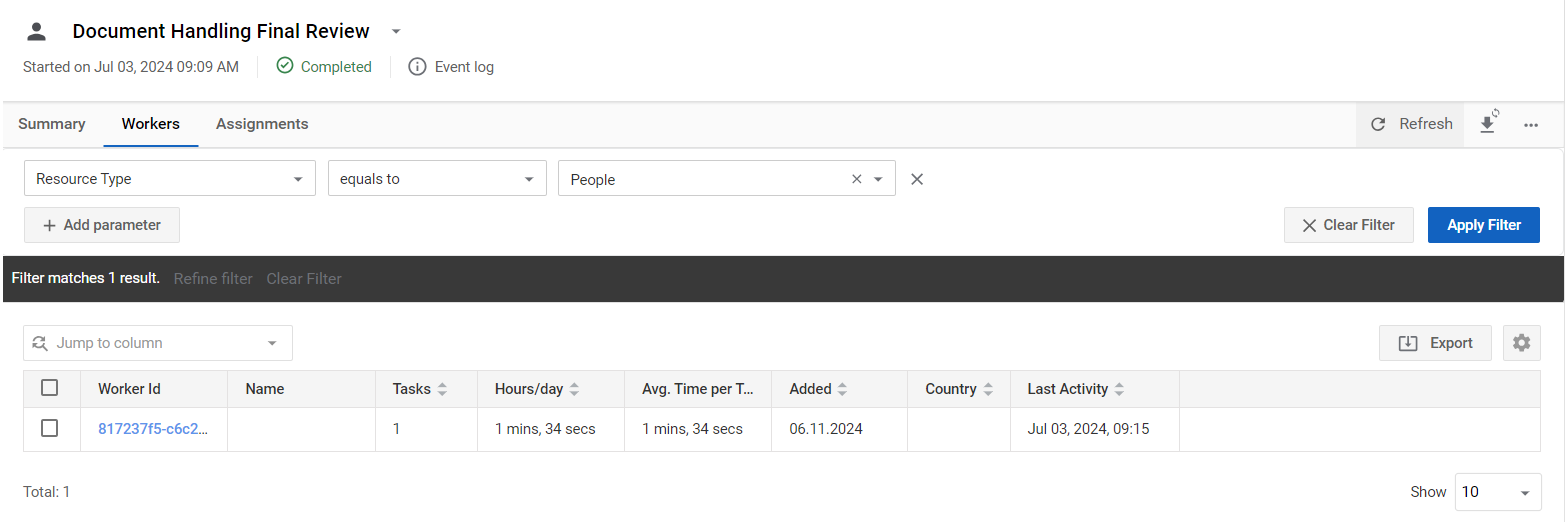
Workers
The Workers tab provides an overview of all human workers involved in a Manual Task or BP, depending on the selected information header.
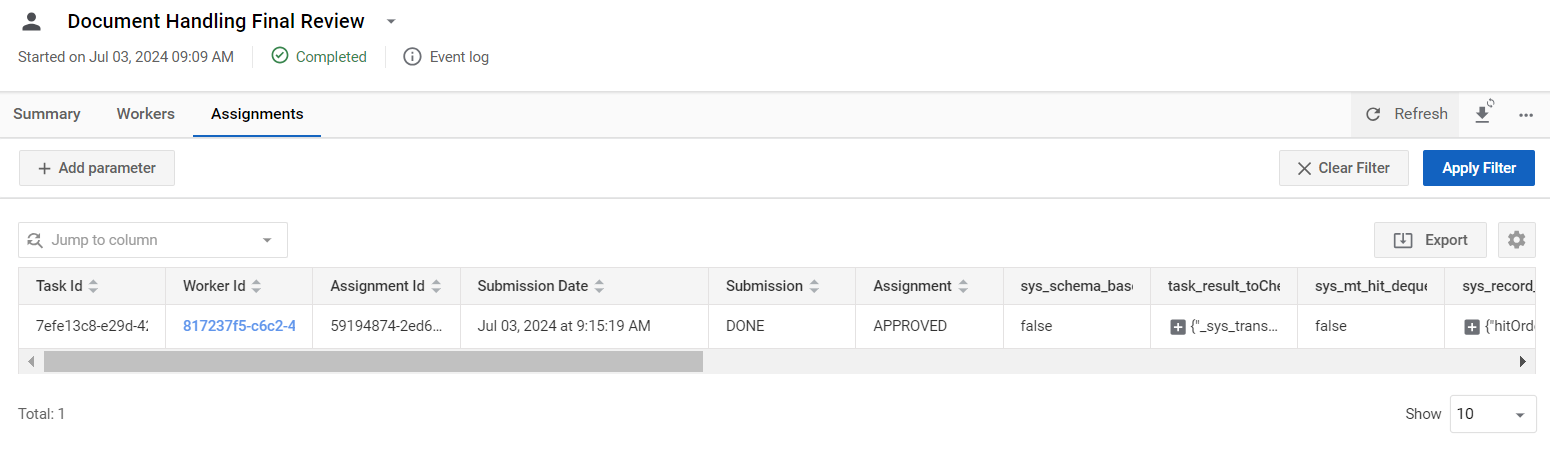
Assignments
The Assignments tab displays information about the workers' answers related to a specific task.
Actions
On the Results tab, the following actions are available:
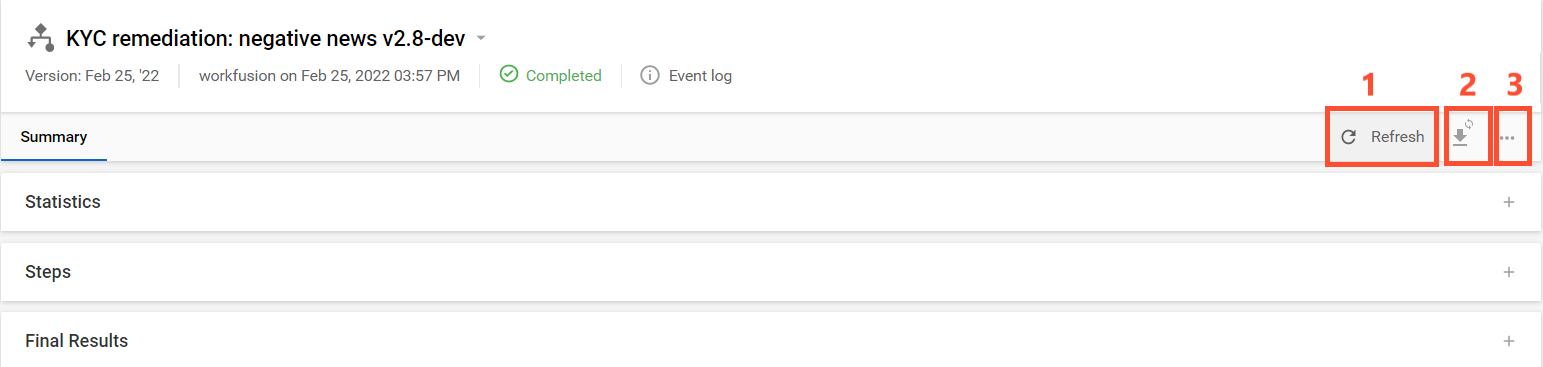
Click to update all information on the Results tab (information header, expanded blocks, tables).
Select to generate and download snapshots of the selected instance.
Select to open a list of actions. These actions are related to the overall Business Process, not only the selected instance.
Depending on the execution status of the BP, the list can include the following actions:
- Copy
- Pause
- Resume
- Stop
- Repair
- Download Original Data
- Delete
Table tools
Table tools apply to all tables in the Results tab:
- Data
- Final Results
- Workers
- Assignments
The tools include the following:
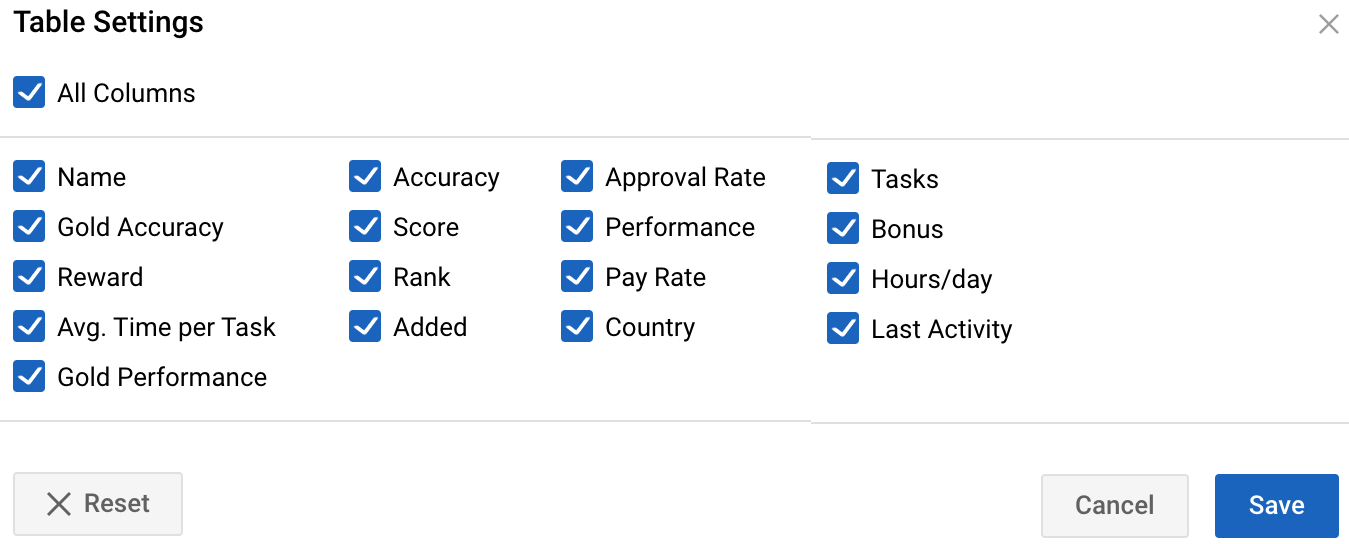
Table settings
In the top right corner of a table, click the cogwheel icon to open the Table Settings menu.

In the menu, select the columns you want to see in your table.
Export
Click the button to export any table in the format of your choice. Mind that the export covers only the columns selected in the Table Settings menu.

Filters
Add one or multiple parameters to filter the table data.

Quick navigation across columns
In the drop-down box, select a column name to quickly navigate to it.

In the drop-down box, select a column name to quickly navigate to it.
View all BPs
To view a list of BPs and their instances, go to Business Processes > View All Business Processes. For more information, read View all Business Processes.