Analyze task execution
To analyze task execution, follow the steps below:
Log in to Kibana.
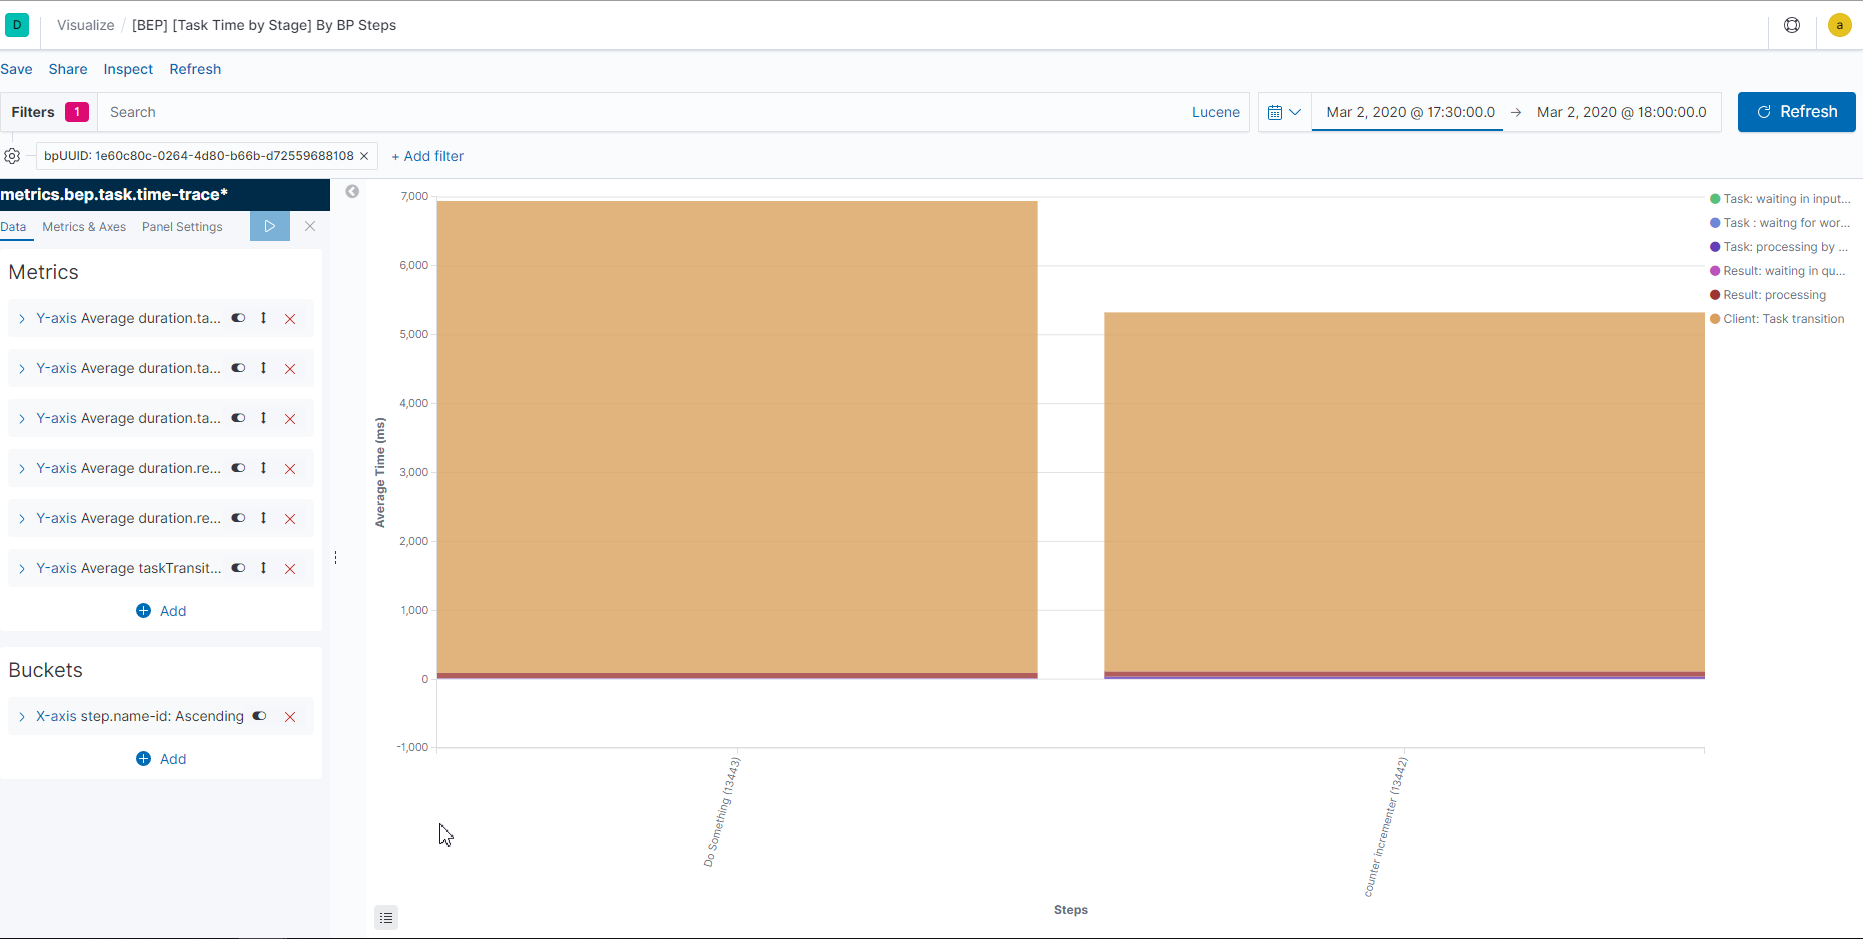
Go to Visualizations > open [BEP][Task Time by Stage] By BP Steps.
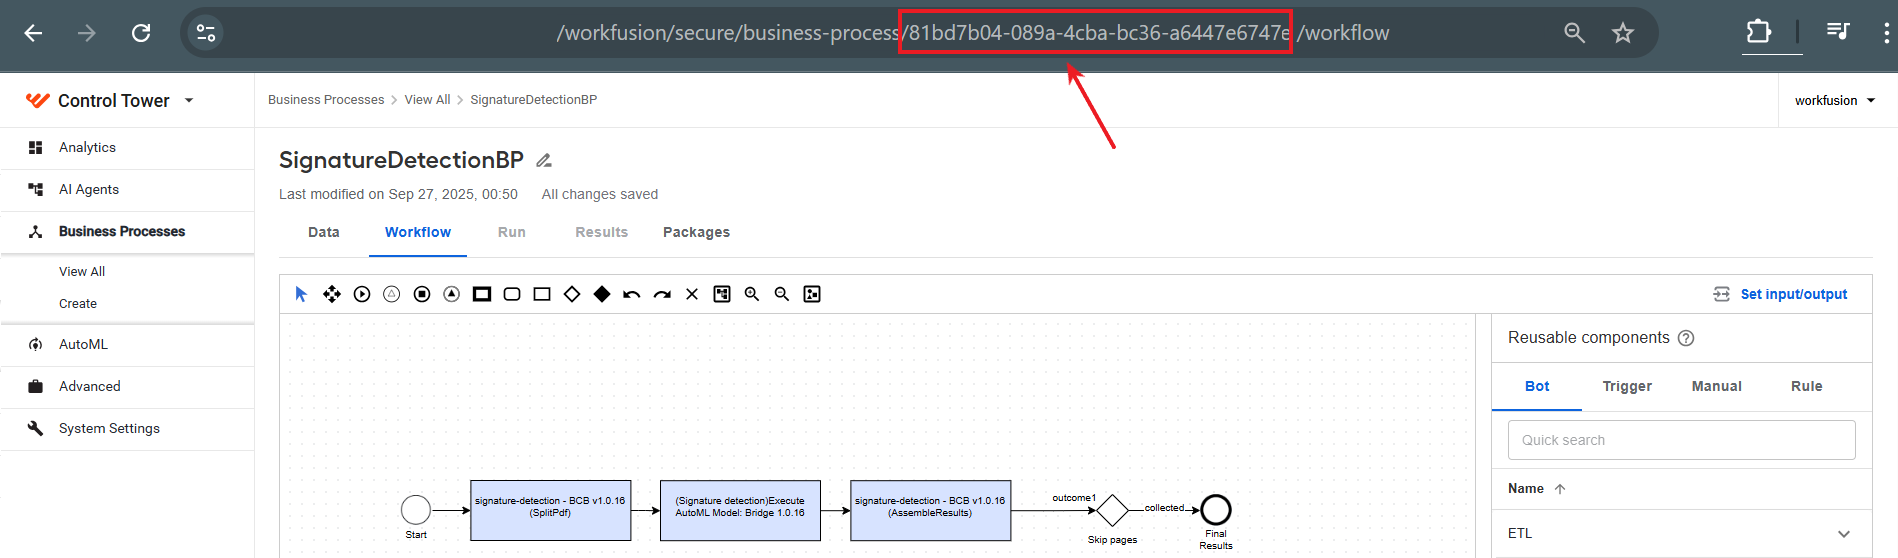
Set filter to bpUUID. Use the UUID of the Business Process obtained from the URL in Control Tower (CT).
Work.AI up to v10.2.9 Work.AI v10.3 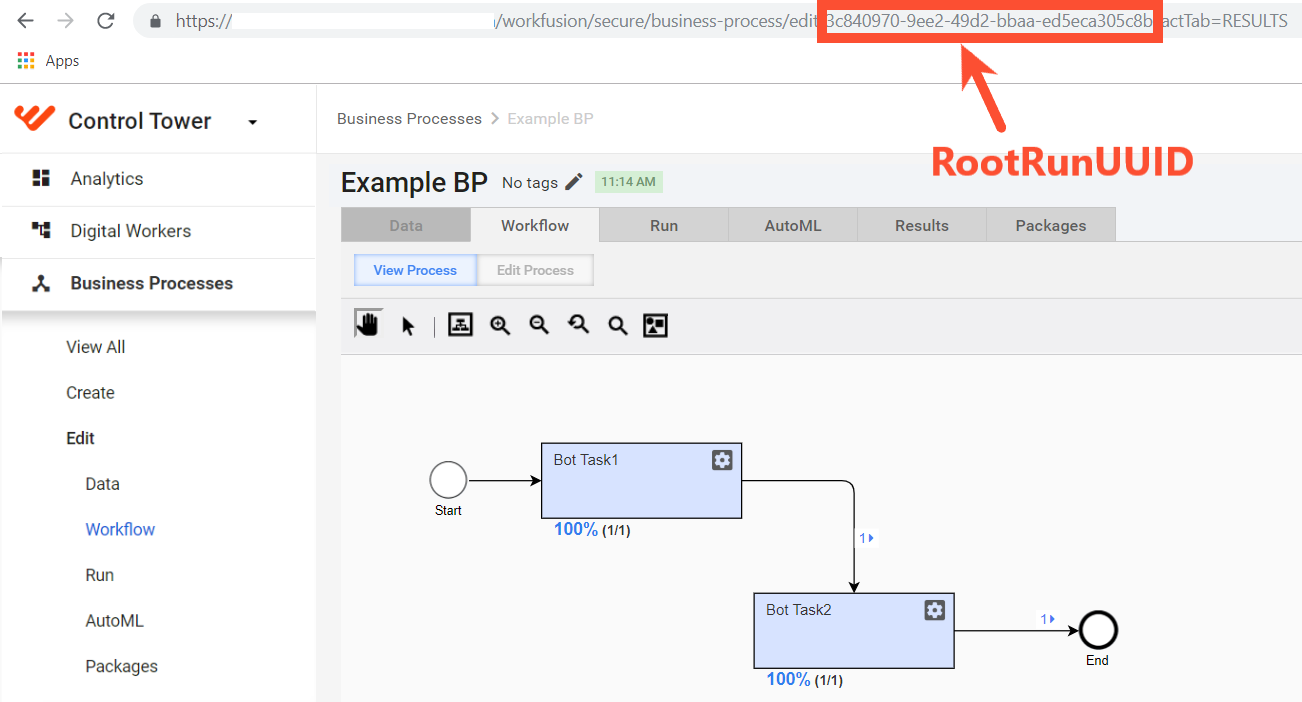
Specify the timeline and click Refresh button.
You'll find the statistics on the average time of the task execution in BEP for the specified period:
If there is no statistics, perform the following steps:
Go to Management > Kibana: Index Patterns > metrics.bep.task.time-trace* > Scripted fields > step.name-id > Edit.
Replace script content with:
if (doc['stepName.keyword'].size() != 0) {
    doc['stepName.keyword'].value + " (" + doc['stepId'].value + ")"
} else {
    'unknown'
}
Save the field and refresh the page of the visualization.
You may find some tasks which are being executed longer than the others and you may want to take a look at the performance of these separate steps according to some time period. For this, you'll need to:
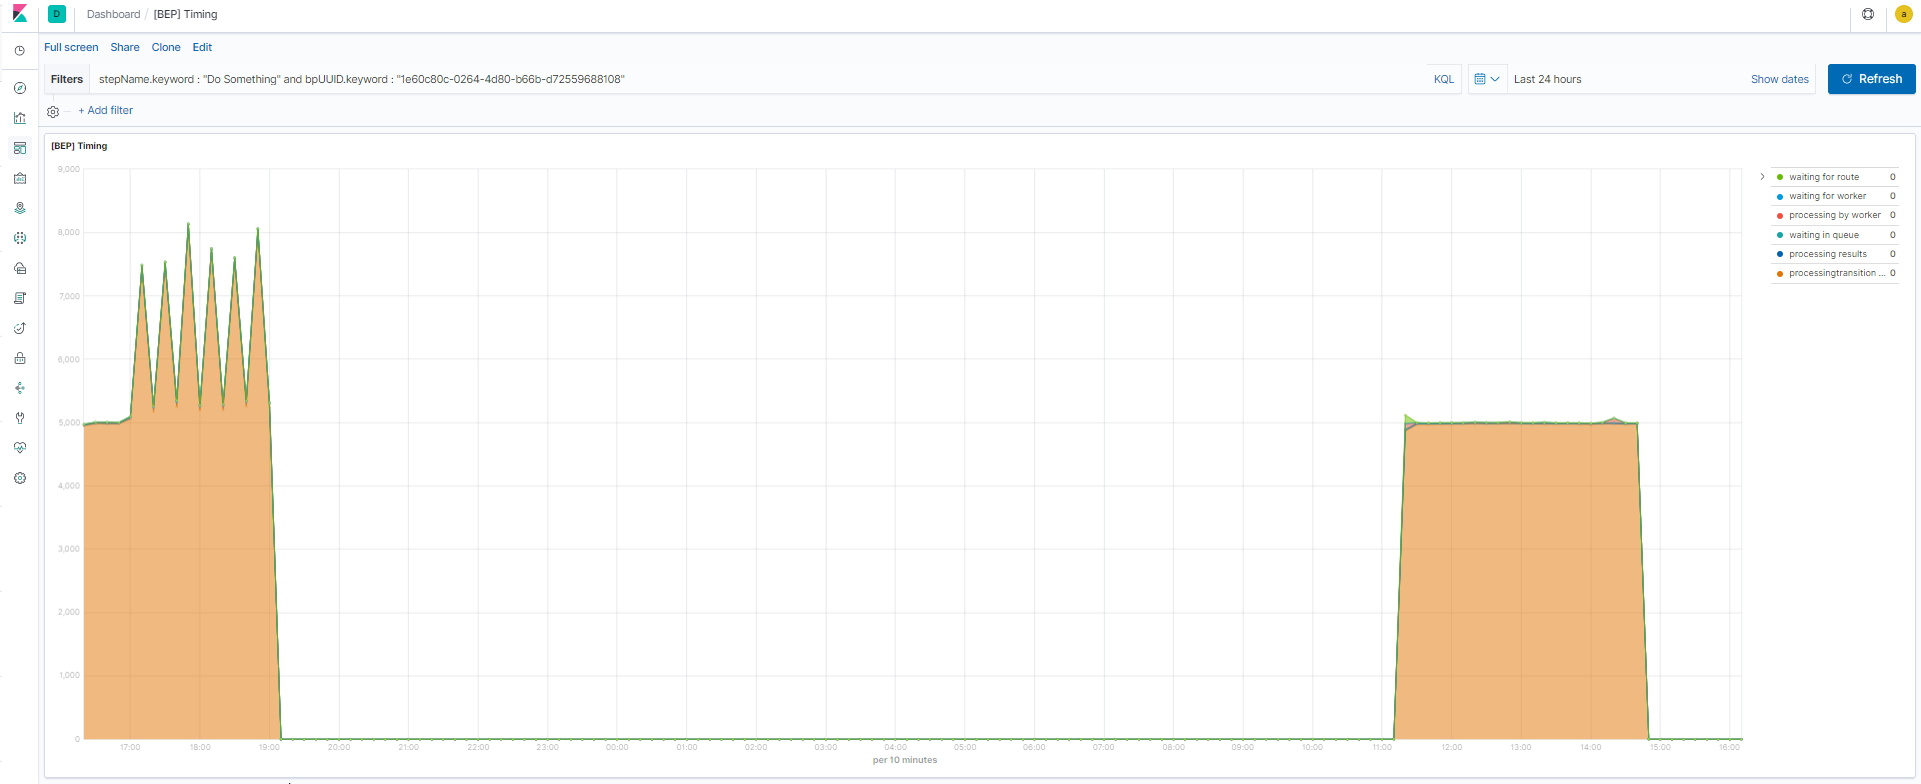
Go to Visualizations and open the [BEP] Timing visualization.
If that visualization is not available in your environment, install it in the following way:
- Go to Management > Kibana: Saved objects > Import.
- Import the bep-timing.ndjson file.
Add the following filters: bpUUID as the uuid of the Business Process obtained from the URL in CT and stepName as the name of the step you want to analyze.
Specify the timeline and click Refresh button.
You'll find the interim statistics on the execution of the task in BEP.