Investigate potential performance degradation causes
The article lists a number of hipotheses about the causes of the Worker performance degradation issues you are experiencing (if any). For each hypothesis, you'll find a description of symptoms, steps to reproduce, and root cause analysis (RCA) tips.
CPU or disk utilization issues
100 % CPU or disk utilization on DB server affects SLA of the BPs running on the platform.
Symptoms
CPU or disk utilization is high, the execution time of steps is exceeding usual values.
Is hypothesis confirmed?
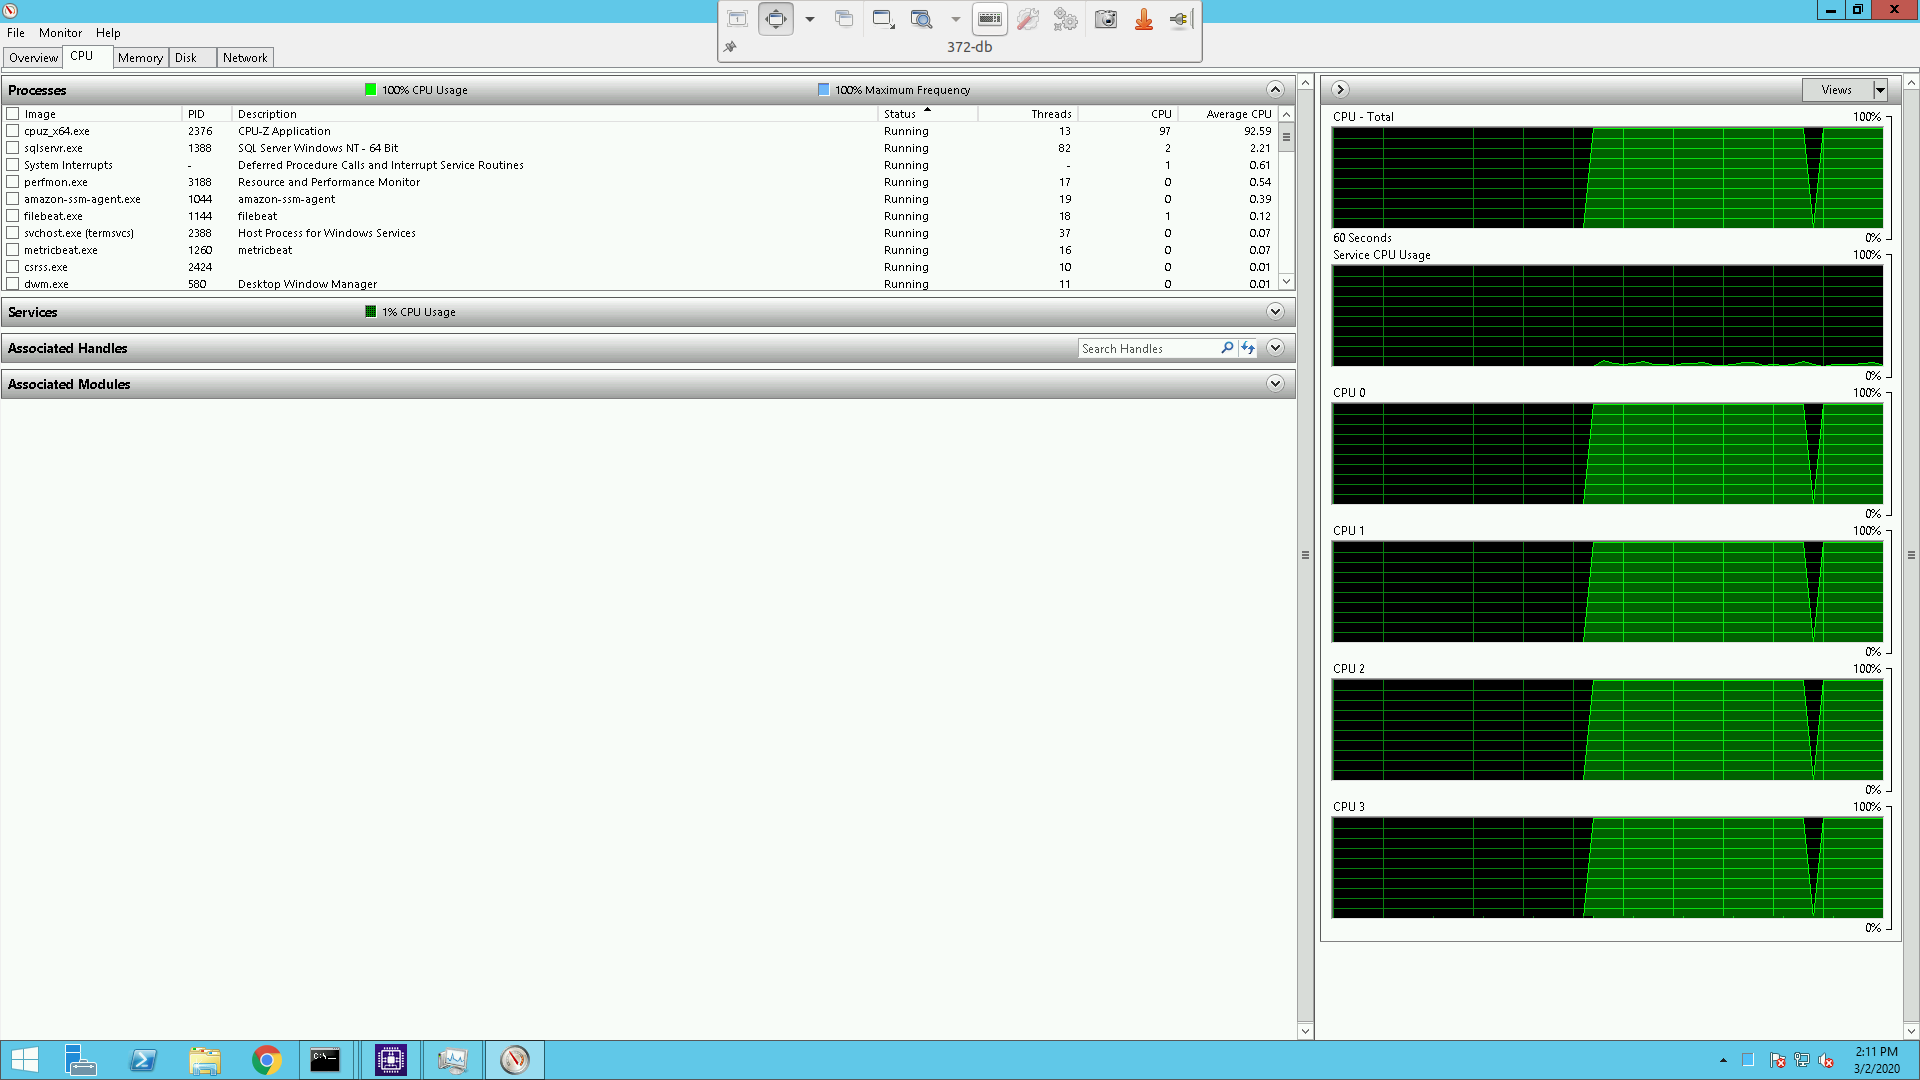
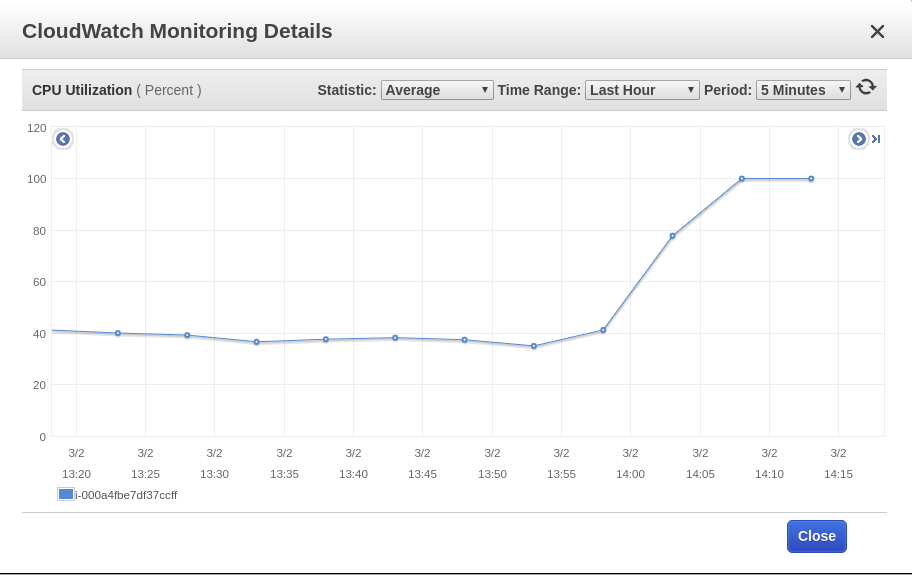
CPU high utilization affects performance in a negative way. However, even when you reach 100% CPU load, the performance is not deteriorated drastically. High disk utilization is more dangerous for performance.
The statistics is as follows:
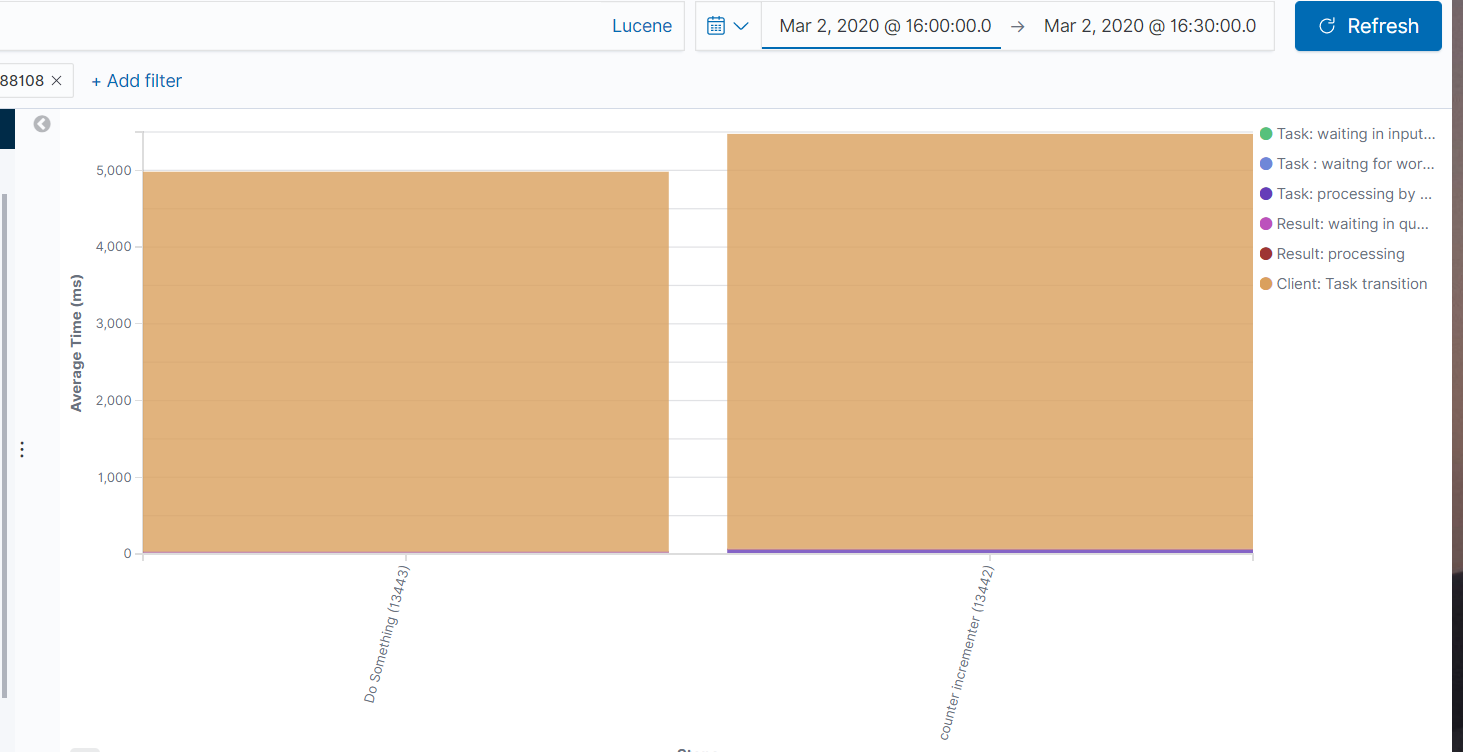
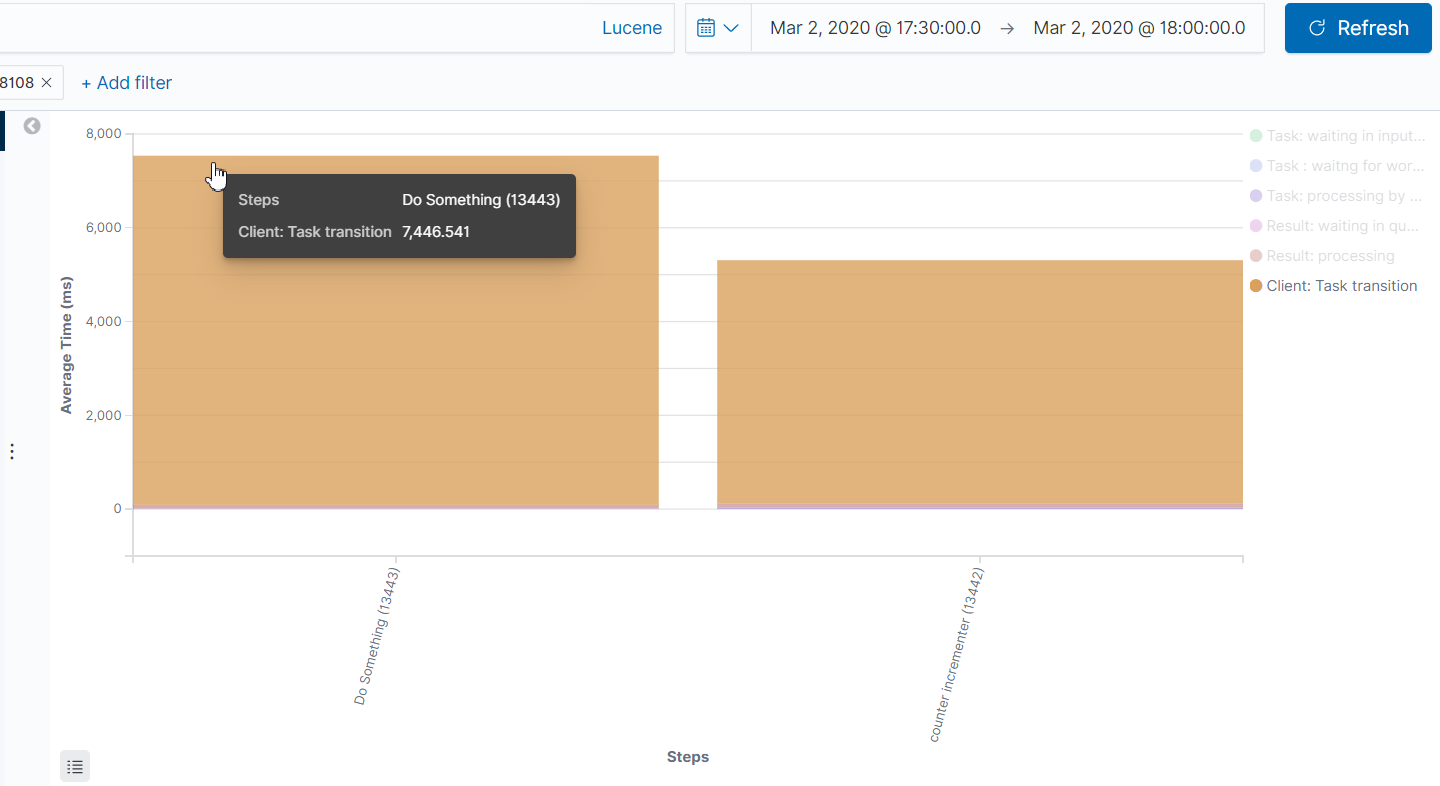
A BP was launched at 16:00. The average time of execution per step didn't exceed 5500 ms.
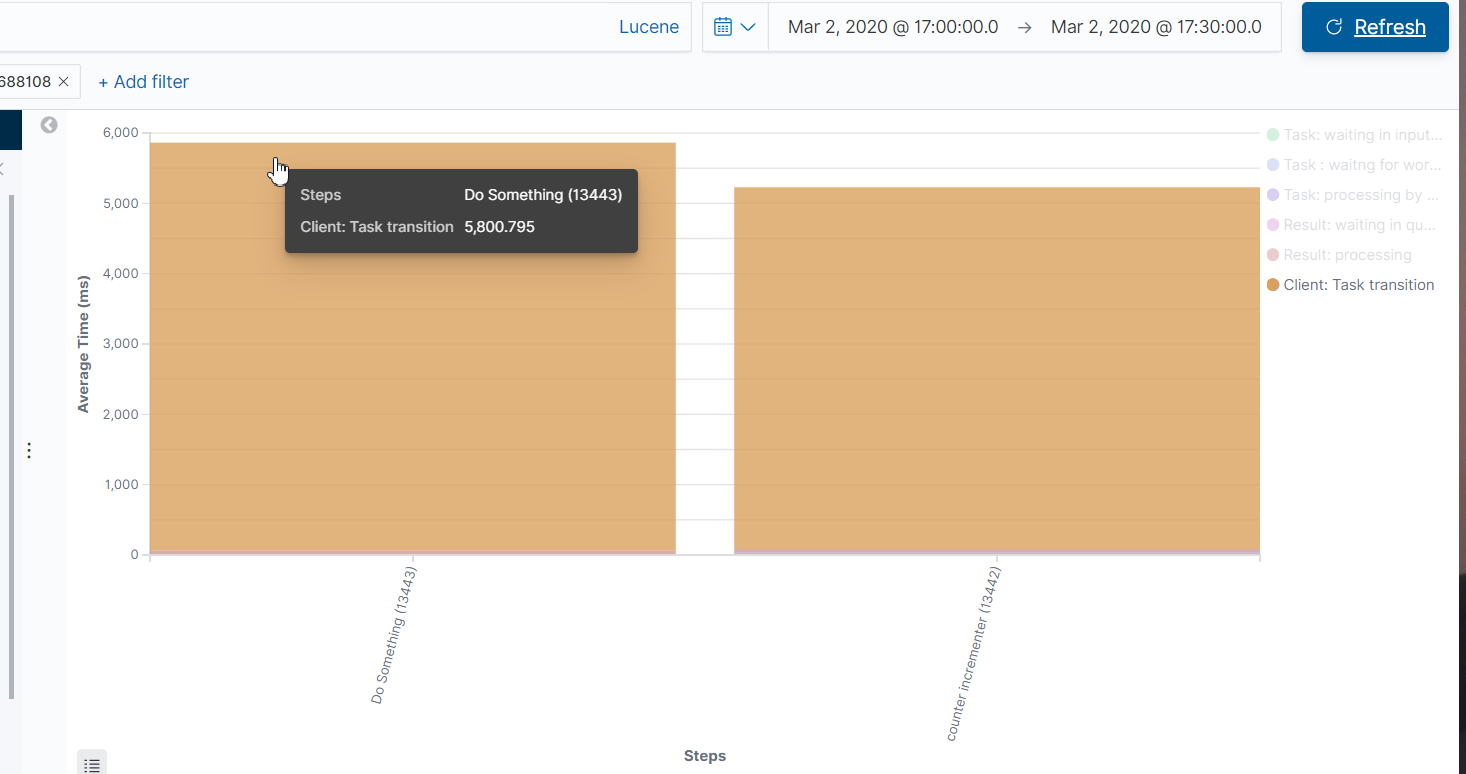
The CPU High Loading script was launched at 17:00 and ran till 17:30. The average time of execution per step reached 5800 ms.
The DISK high loading script was launched at 17:35 and ran till 18:00. The average time of execution per step reached 7447 ms.
RCA
If there is no statistics on the database (DB) metrics in Kibana, you can take a look at the CPU and disk utilization rates on the Windows machine or AWS console.
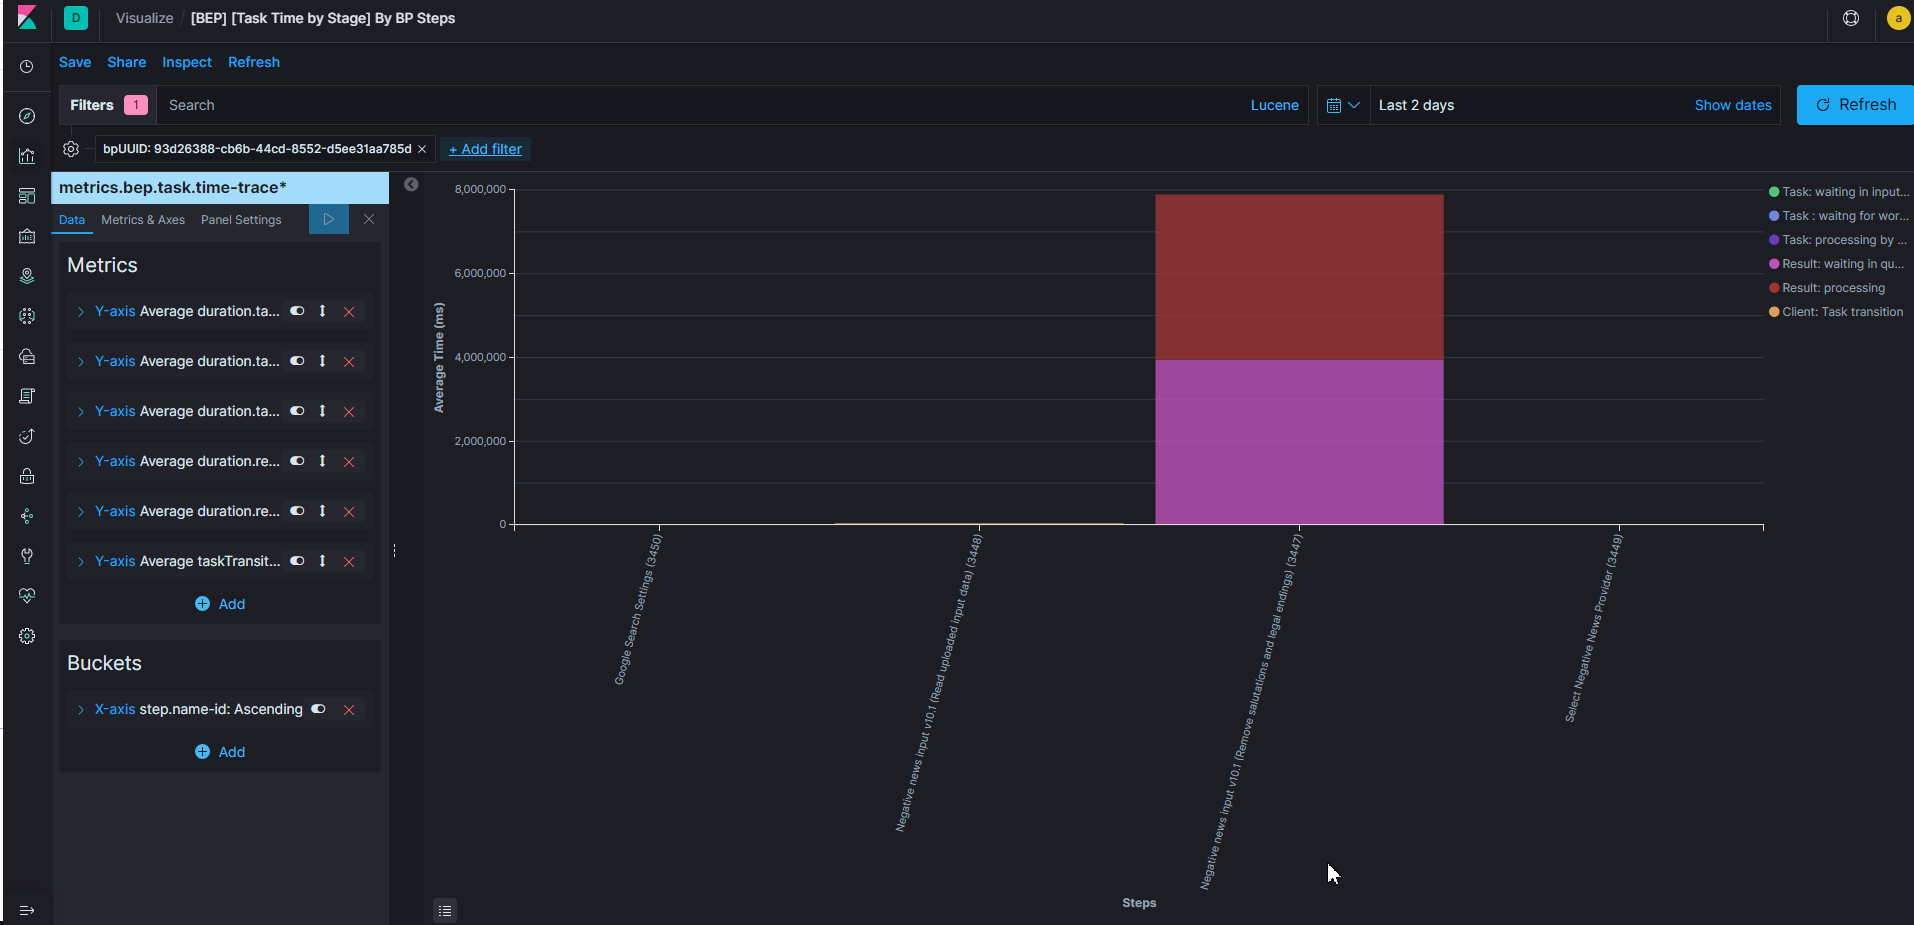
To get the statistics on BP step execution, refer to the [BEP][Task Time by Stage] By BP Steps Kibana visualization.
Steps to reproduce
Run BP for 30 minutes.
Using the following SQL queries, load DB at 100%:
-- CPU high loading:
declare @start_time datetime, @dummy bigint, @secs_to_load int;
set @secs_to_load = 5;
set @start_time = getDate();
while dateAdd( second, @secs_to_load, @start_time) > getDate()
   set @dummy = power(2, 30);
-- DISK high loading:
declare @secs_to_load int = 10
, @batch_size int = 1000
, @start_time datetime = getDate()
, @cnt_ins int;
drop table if exists #tmp_load;
create table #tmp_load( id int, c1000 char(1000));
while dateAdd( second, @secs_to_load, @start_time) > getDate()
begin
set @cnt_ins = 0;
while @cnt_ins < 1000
begin
insert into #tmp_load( id, c1000) values( 1, 'x');
set @cnt_ins = @cnt_ins + 1
end
delete from #tmp_load;
endContinue running the BP for another 30 minutes.
Stop the DB load procedure.
Run the BP for another 30 minutes.
Issues related to DB server deadlocks
Deadlocks on the DB server affect the BP performance.
Symptoms
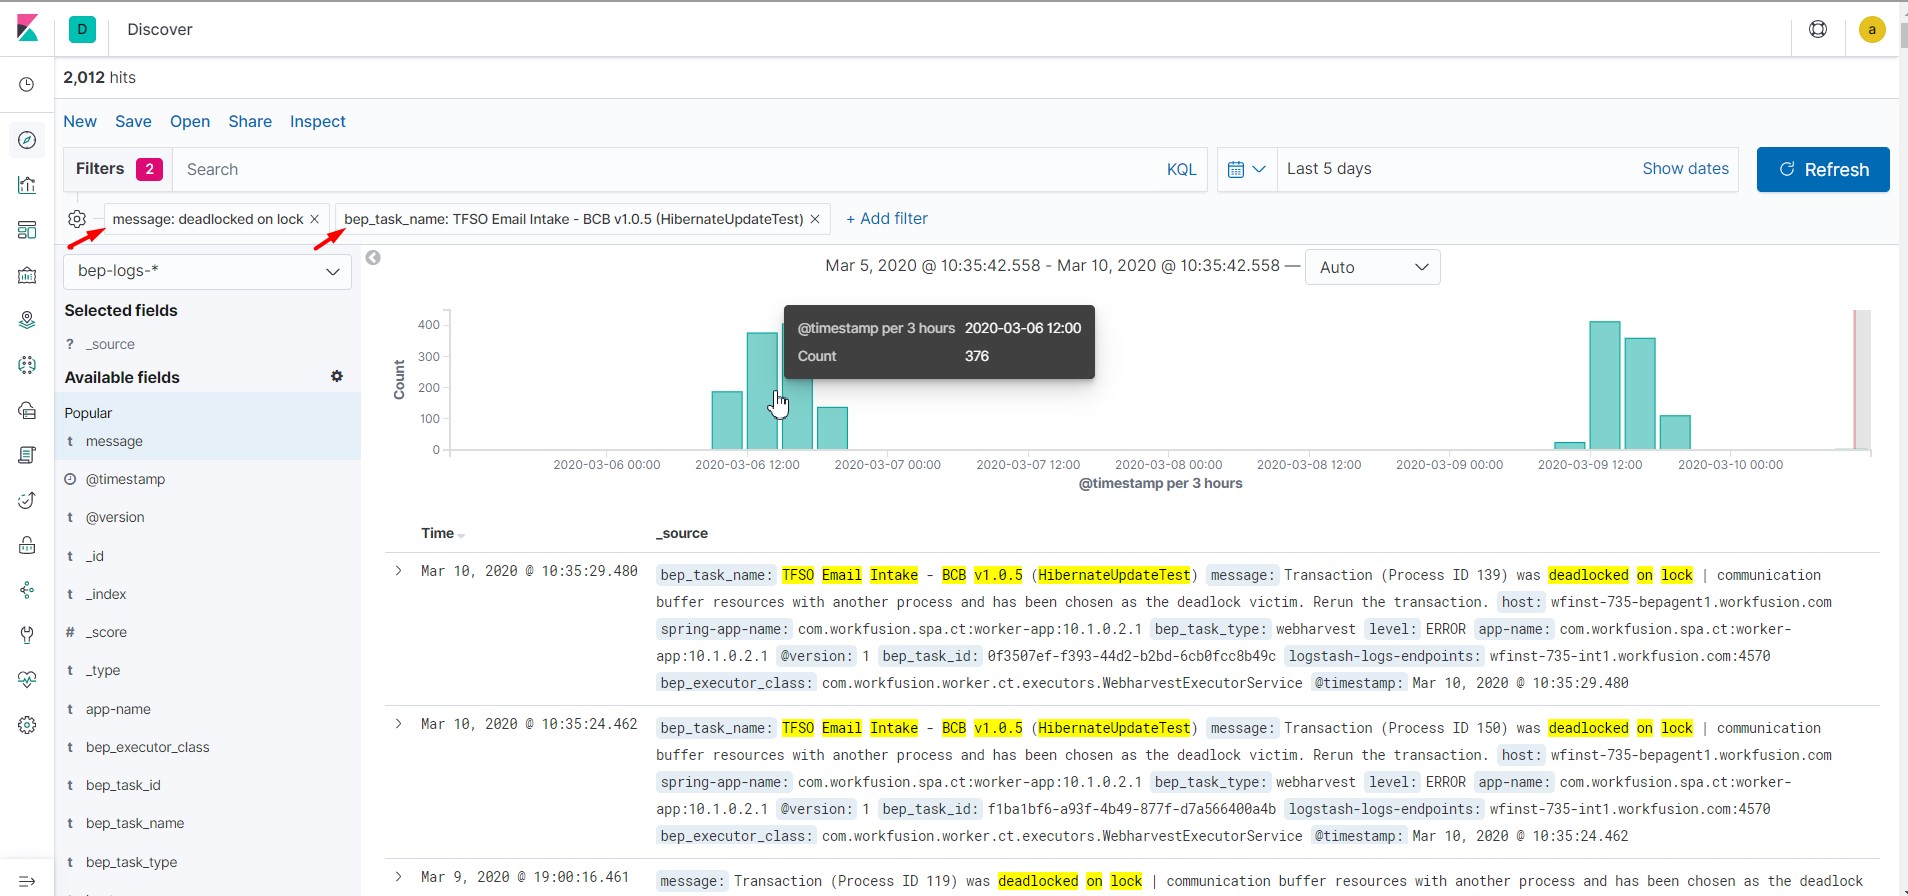
The event log includes a lot of Transaction (Process ID XXX) was deadlocked on lock messages. Some hits fail, which leads to overall performance degradation.
Is hypothesis confirmed?
Deadlock was acquired on a Data Store with ~500 000 records.
Event log: deadlock_event_message.txt
To find deadlock data in Kibana, go to Discover > search by the deadlocked on lock message and step name if necessary. The count of errors over the specified period of time is displayed before the log messages itself.
RCA
Read about the DB locks analysis.
Steps to reproduce
There are two Business Processes in which you execute DB operations over Hibernate:
- One BP is doing DB inserts into a Data Store.
- The other BP is doing the read and update operations from the same Data Store.
BEP CPU capacity issues
BEP reaches 80% of CPU capacity, which affects the BP performance.
Symptoms
CPU is highly utilized in the BEP cluster (on all Agent servers).
Is hypothesis confirmed?
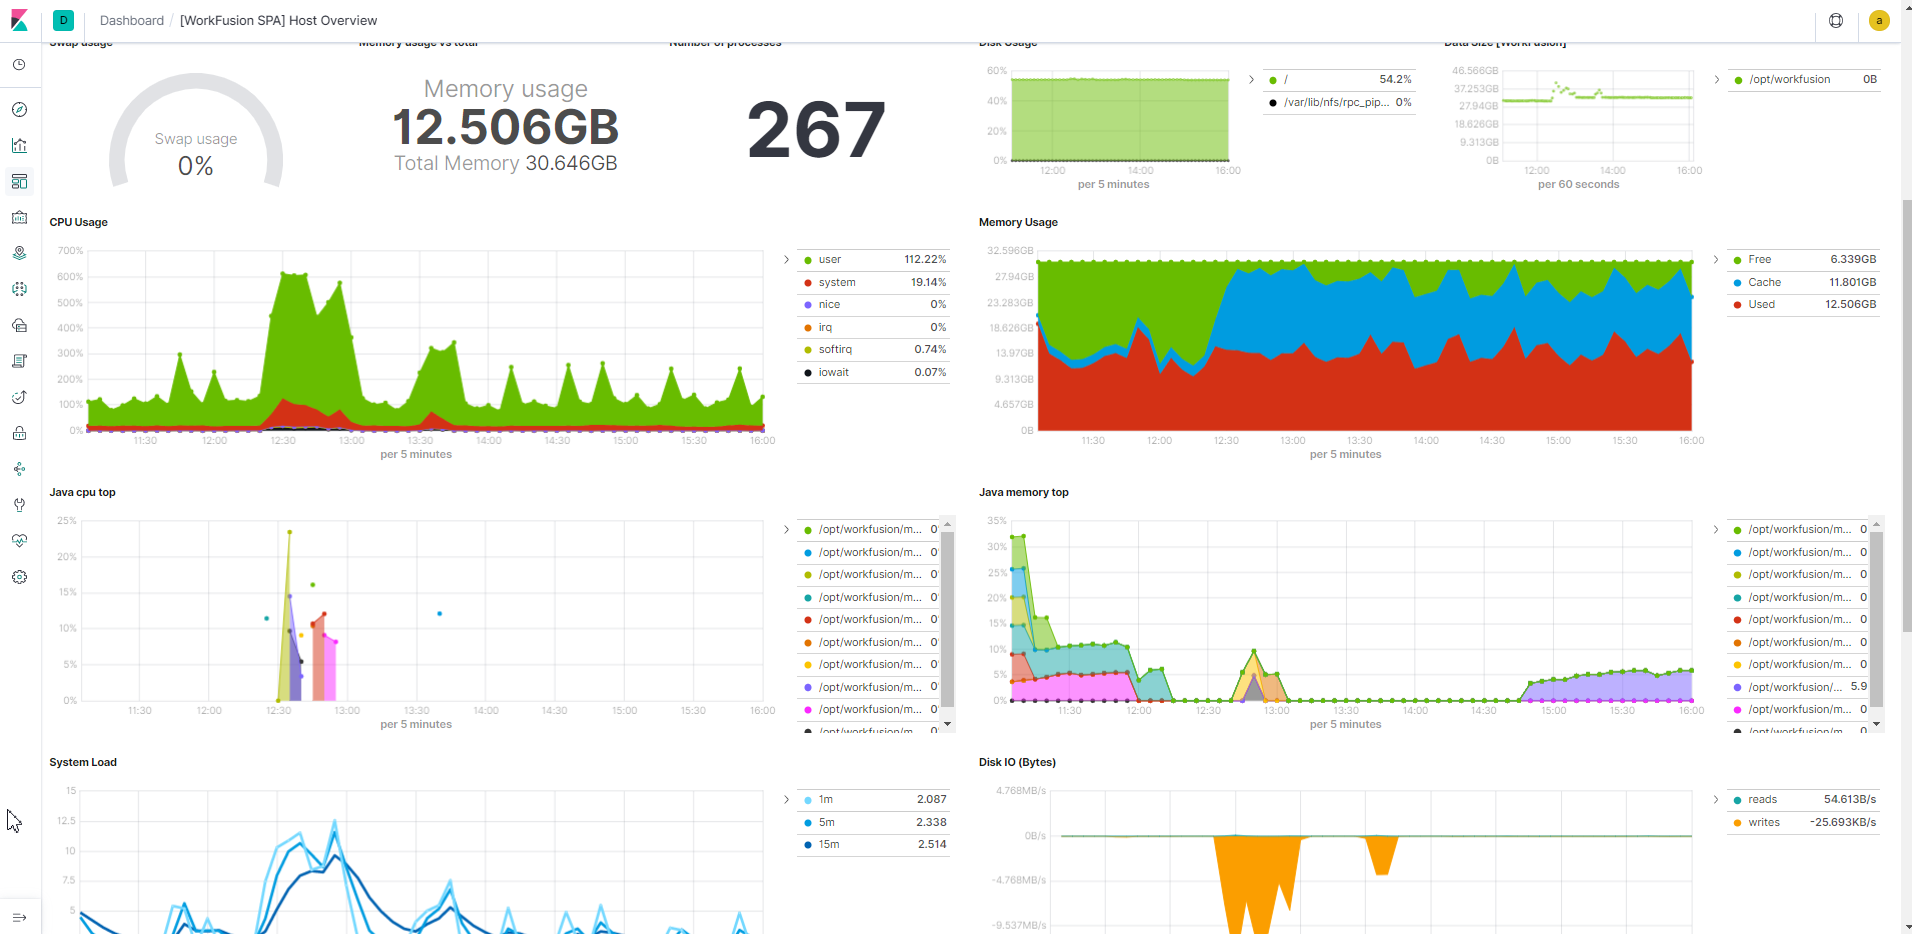
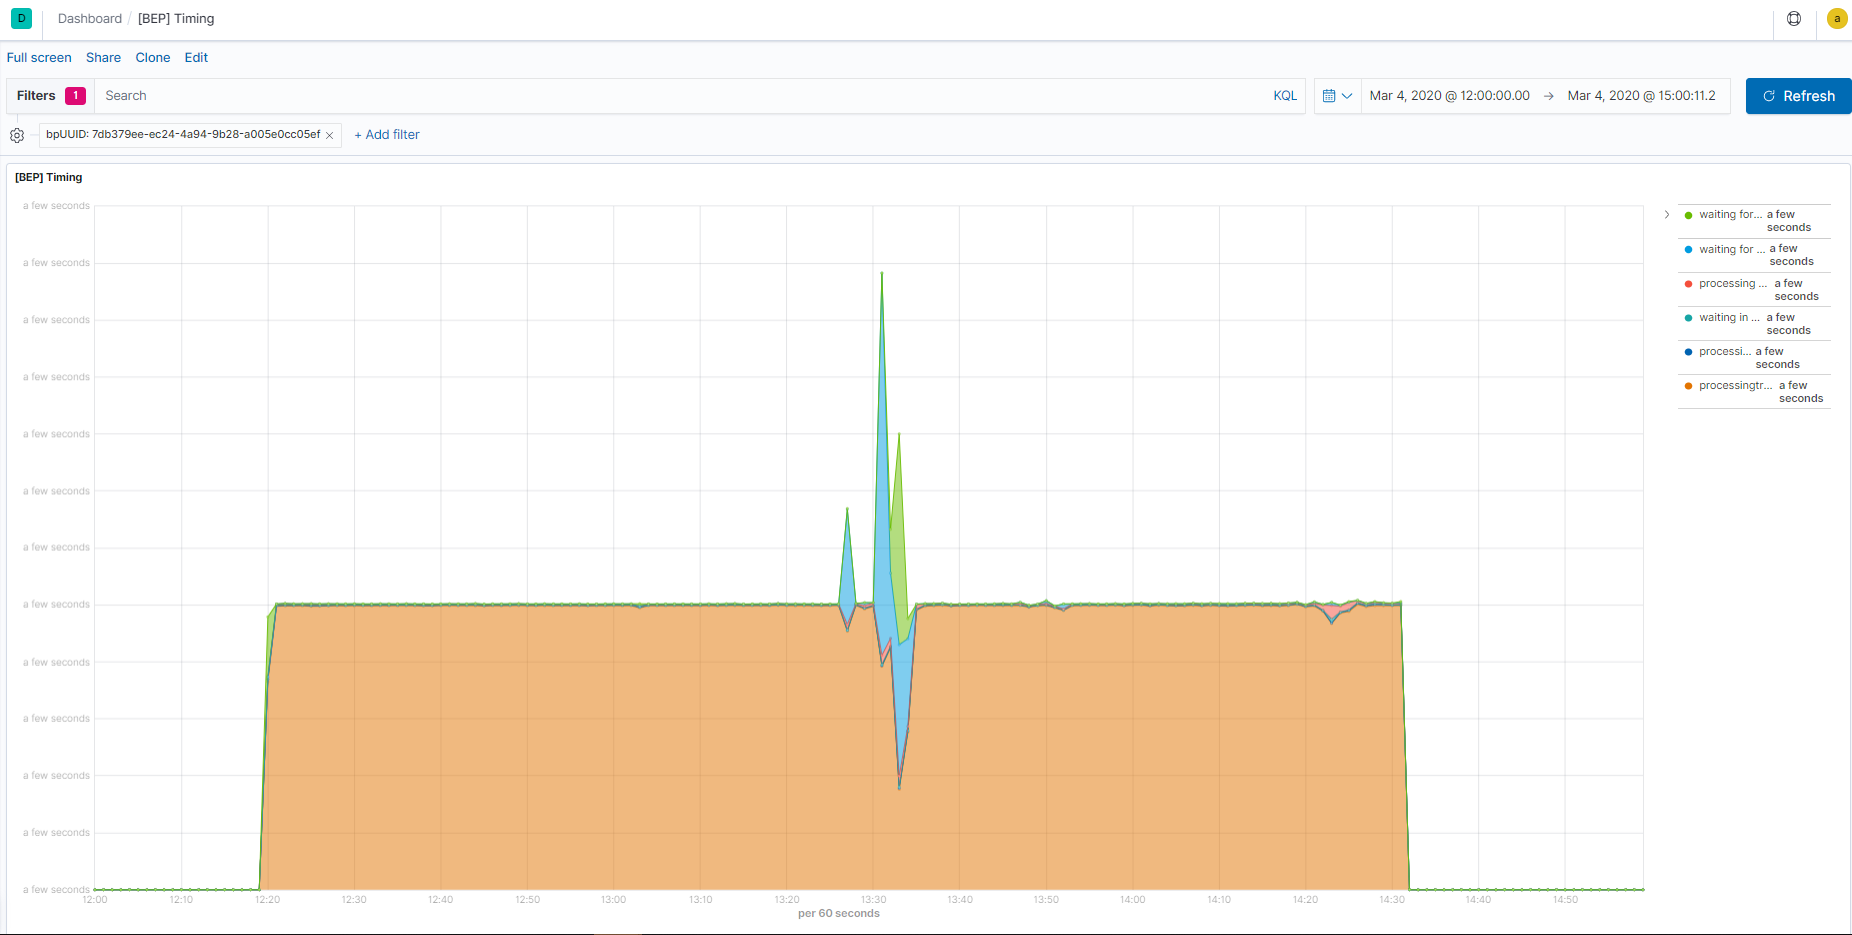
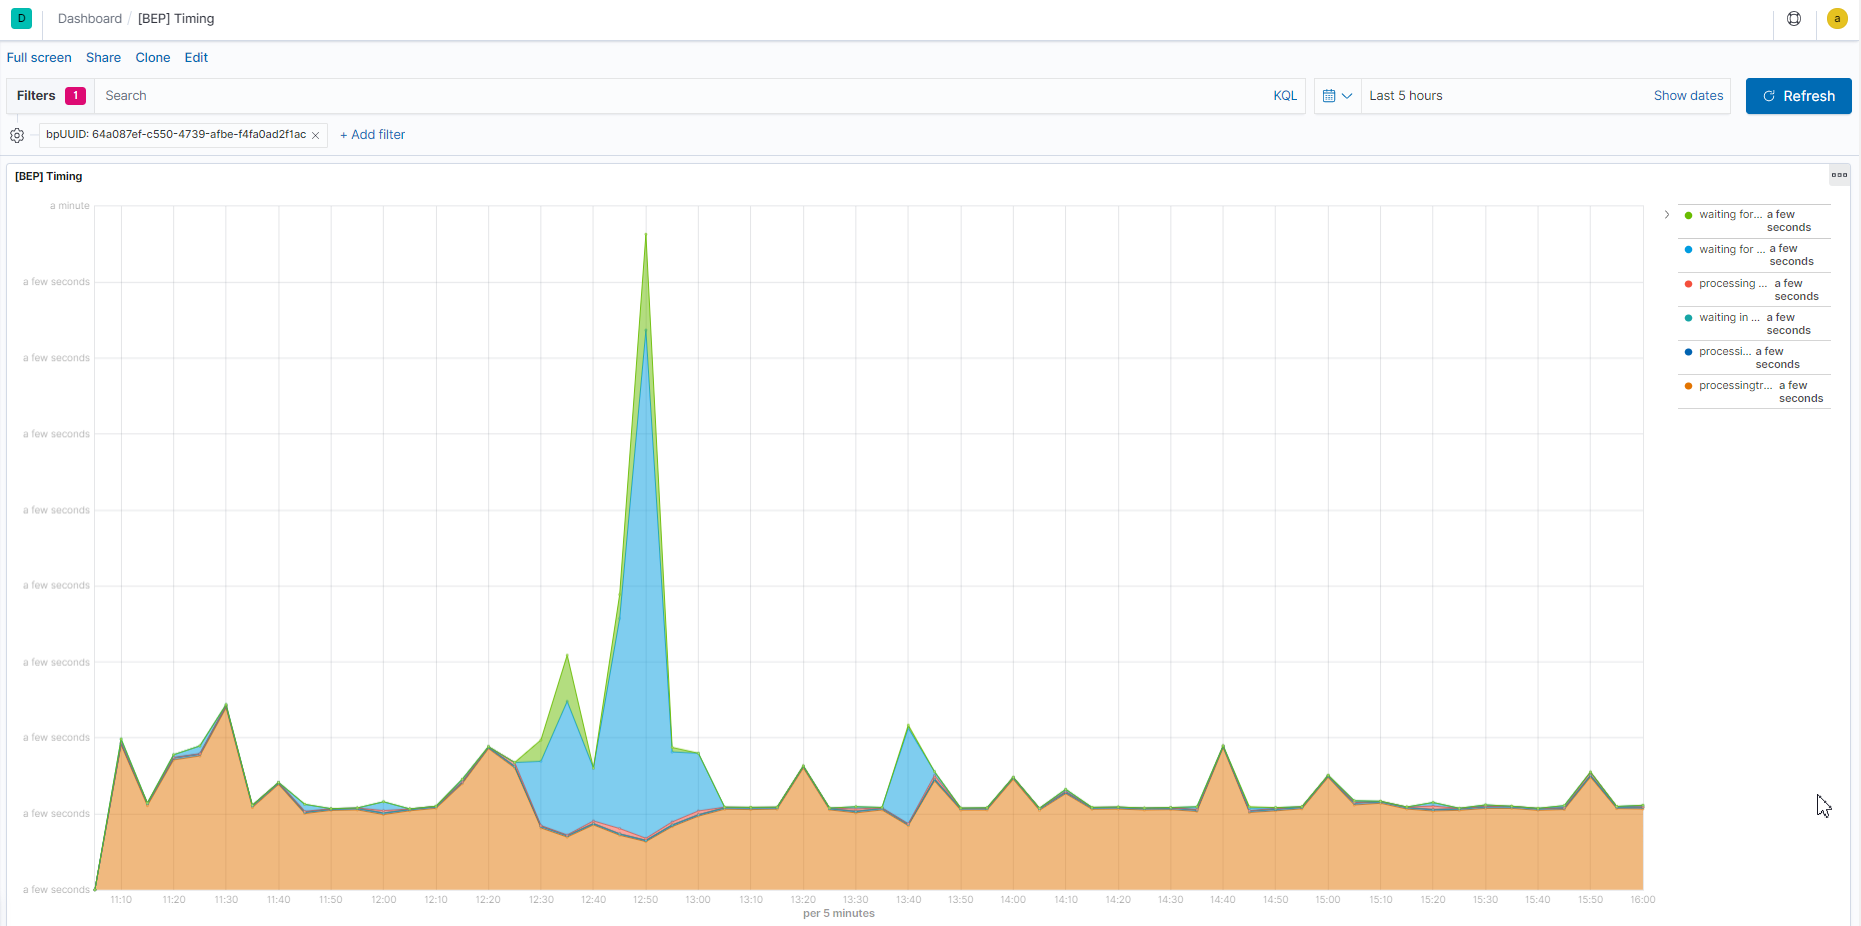
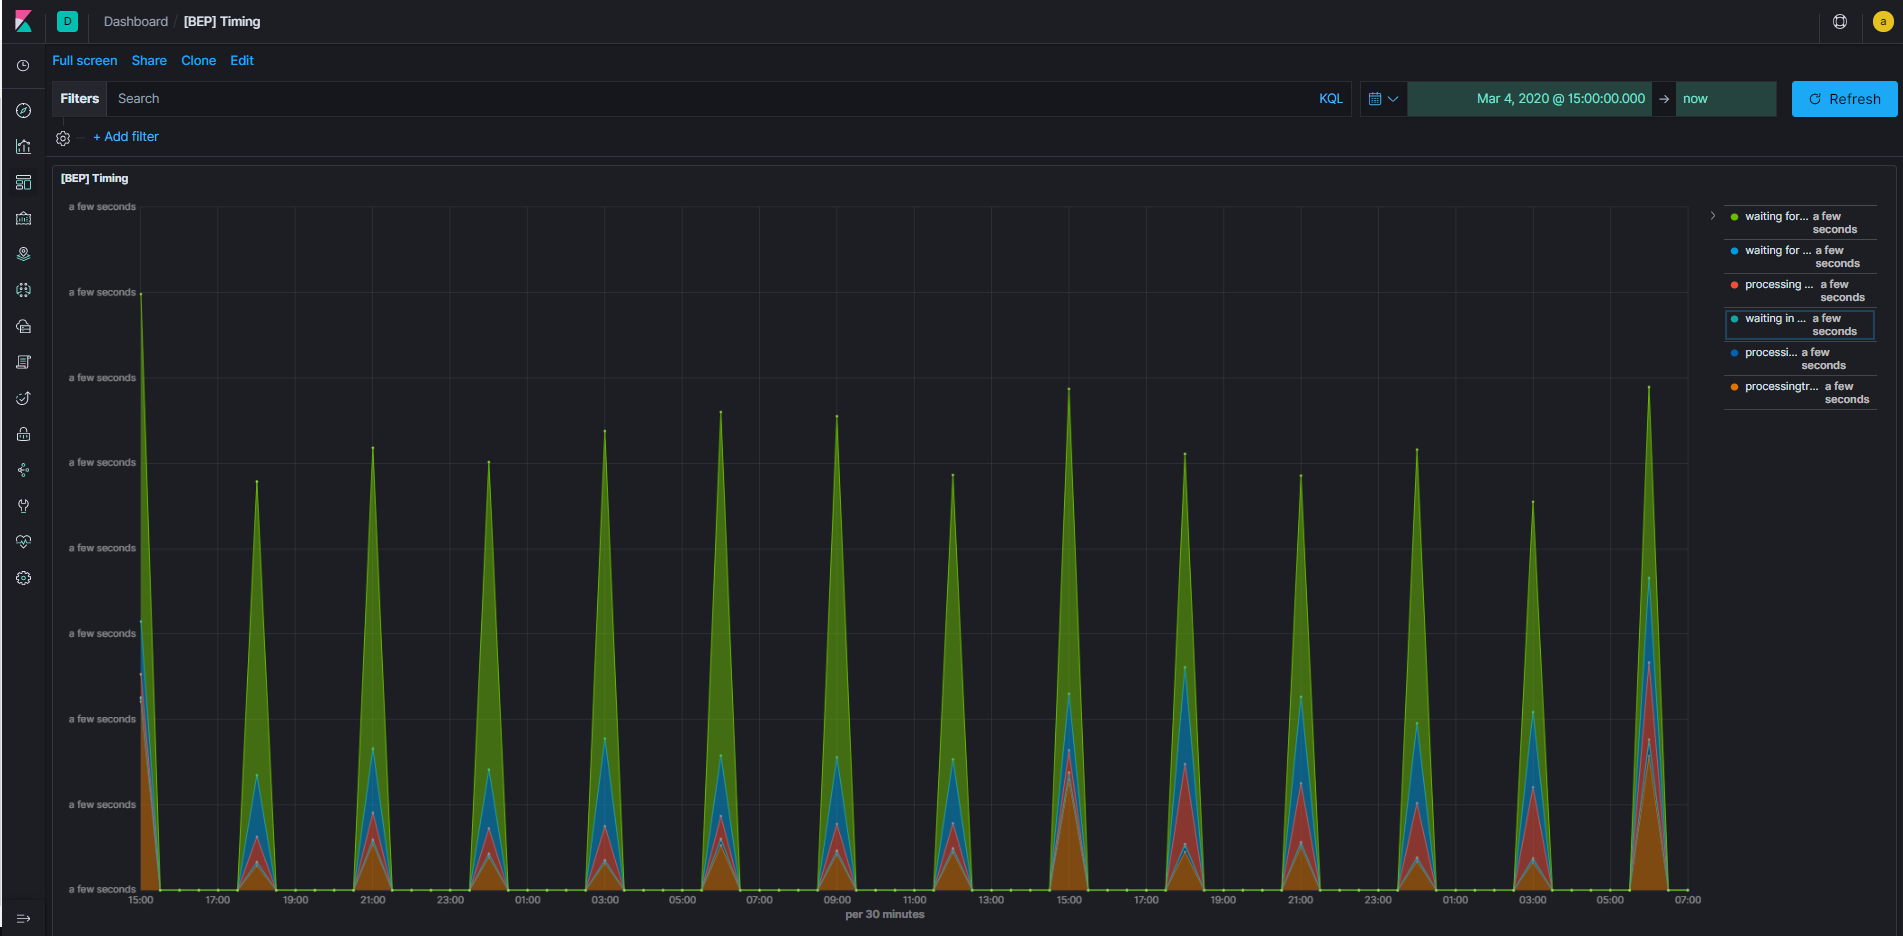
The performance degradation is observed when multiple Business Processes are launched simultaneously as the number of steps waiting in the task queue increases. The subsequent performance degradation is not observed.
Statistics per Business Process launched for five hours:
 \
\
 \
\
Statistics per Business Process launched for two days:
 \
\
 \
\
RCA
Read about the task execution analysis.
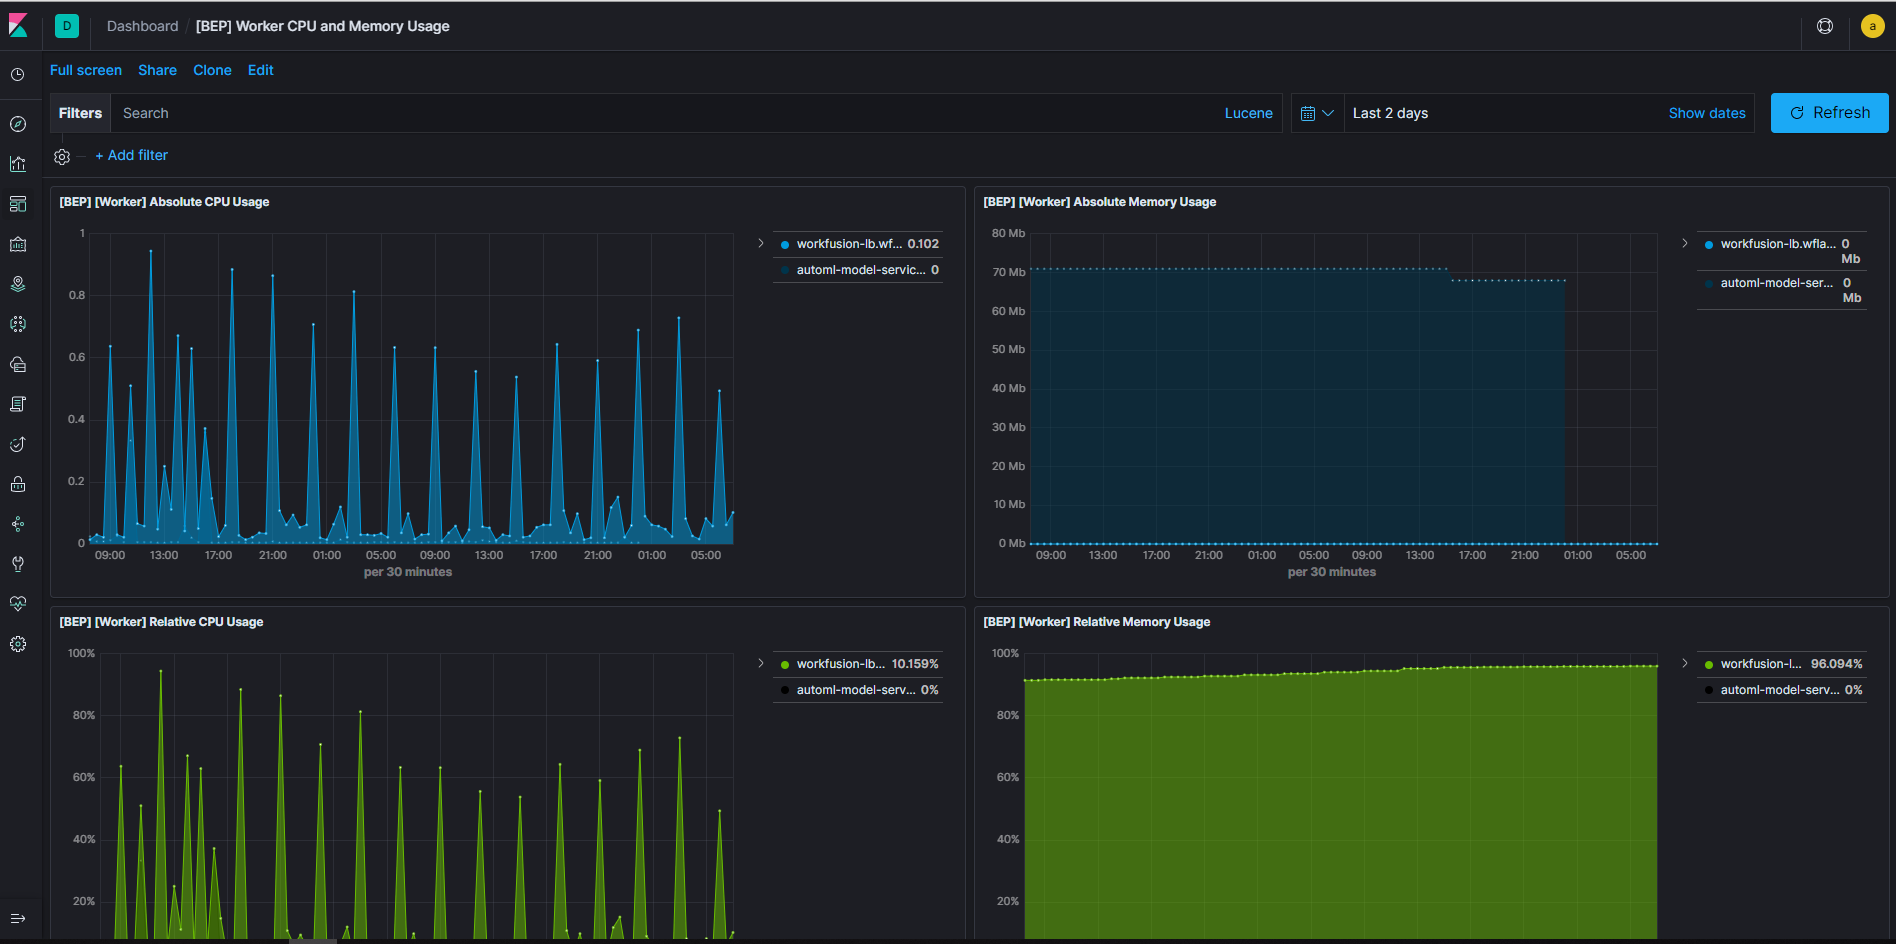
The CPU and memory consumption in the BEP cluster can be analyzed using the following graphs in Kibana:
- [WorkFusion IA Cloud] Host Overview
- [BEP] Worker CPU and Memory Usage
Steps to reproduce
- Run BP for 30 minutes.
- Launch a lot of Business Processes simultaneously to create high CPU load in the BEP cluster.
HAProxy and Nginx connection issues
The number of simultaneous connections for HAProxy and Nginx are low.
Symptoms
There are a lot of 50x error messages in the HAProxy and Nginx log files.
Is hypothesis confirmed?
Initial state
Summary:\ Total: 1353.8391 secs\ Slowest: 20.0211 secs\ Fastest: 0.0008 secs\ Average: 4.0329 secs\ Requests/sec: 491.0672
Total data: 56962882 bytes\ Size/request: 86 bytes
Response time histogram:\ 0.001 [1] |\ 2.003 [125356] |■■■■■■■■■■■■■■■■\ 4.005 [318891] |■■■■■■■■■■■■■■■■■■■■■■■■■■■■■■■■■■■■■■■■\ 6.007 [93648] |■■■■■■■■■■■■\ 8.009 [51282] |■■■■■■\ 10.011 [40370] |■■■■■\ 12.013 [19728] |■■\ 14.015 [7125] |■\ 16.017 [2882] |\ 18.019 [1411] |\ 20.021 [812] |
Latency distribution:\ 10% in 1.6116 secs\ 25% in 2.2224 secs\ 50% in 3.1501 secs\ 75% in 4.7207 secs\ 90% in 8.2590 secs\ 95% in 9.9313 secs\ 99% in 13.4340 secs
Details (average, fastest, slowest):\ DNS+dialup: 0.9857 secs, 0.0008 secs, 20.0211 secs\ DNS-lookup: 0.0209 secs, 0.0000 secs, 1.0047 secs\ req write: 0.0126 secs, 0.0000 secs, 2.1944 secs\ resp wait: 2.6622 secs, 0.0001 secs, 19.7465 secs\ resp read: 0.0495 secs, 0.0000 secs, 2.1365 secs
Status code distribution:\ [200] 129764 responses\ [500] 796 responses\ [502] 5564 responses\ [503] 525382 responses
Error distribution:\ [2052] Get https://HOST:443/workfusion/login: EOF\ [1268] Get HOST:443/workfusion/login: net/http: request canceled (Client.Timeout exceeded while awaiting headers)
After tuning
Summary:\ Total: 183.3552 secs\ Slowest: 14.8303 secs\ Fastest: 0.7499 secs\ Average: 5.9300 secs\ Requests/sec: 501.6384
Response time histogram:\ 0.750 [1] |\ 2.158 [572] |■\ 3.566 [5622] |■■■■■■\ 4.974 [17830] |■■■■■■■■■■■■■■■■■■■■■\ 6.382 [34689] |■■■■■■■■■■■■■■■■■■■■■■■■■■■■■■■■■■■■■■■■\ 7.790 [22040] |■■■■■■■■■■■■■■■■■■■■■■■■■\ 9.198 [8553] |■■■■■■■■■■\ 10.606 [2080] |■■\ 12.014 [503] |■\ 13.422 [68] |\ 14.830 [20] |
Latency distribution:\ 10% in 3.9665 secs\ 25% in 4.9238 secs\ 50% in 5.8012 secs\ 75% in 6.9138 secs\ 90% in 7.9770 secs\ 95% in 8.6708 secs\ 99% in 10.2173 secs
Details (average, fastest, slowest):\ DNS+dialup: 1.6223 secs, 0.7499 secs, 14.8303 secs\ DNS-lookup: 0.0213 secs, 0.0000 secs, 1.1840 secs\ req write: 0.0201 secs, 0.0000 secs, 1.6301 secs\ resp wait: 4.2289 secs, 0.1312 secs, 9.9716 secs\ resp read: 0.0582 secs, 0.0000 secs, 1.3366 secs
Status code distribution:\ [200] 91978 responses
RCA
2000 connections are not enough for HAProxy to work with all applications. Adding low timeouts and applications cannot operate in mid-to-high performance.
Steps to reproduce
Tool that was used: written in Go ApacheBenchmark with the following parameters.
./hey_linux_amd64 -z 3m -m GET -c 3000 https://HOST/workfusion/api/livenessTo debug extra settings enabled on HAProxy:
listen  stats
        bind            *:1936
        mode            http
        log             global

        maxconn 10

        clitimeout      100s
        srvtimeout      100s
        contimeout      100s
        timeout queue   100s

        stats enable
        stats hide-version
        stats refresh 30s
        stats show-node
        stats auth admin:password
        stats uri  /haproxy?stats
High disk utilization issue
The disk IO utilization for a Metricbeat process is high.
Symptoms
Disk utilization is high.
Is hypothesis confirmed?
The Metricbeat service causes high disk IO (read operations) on a server.
The Metricbeat configuration includes the workfusion.yml file to monitor the disk space consumed by the installation folder. To count how much disk space is used in the installation folder, Metricbeat accesses each file.
Too many small-size files can cause high disk read operations.
Number of files
[wf-inst@app modules.d]$ ll /opt/workfusion/shared/minio/data/.minio.sys/buckets/doc-upload/highlights/document-country/ | wc -l
244983
[wf-inst@app doc-upload]$ pwd
/opt/workfusion/shared/minio/data/.minio.sys/buckets/doc-upload
[wf-inst@app doc-upload]$ find ./ -type f | wc -l
1011378
RCA
Starting from v10.3, MinIO is replaced with S3 Manager for file storage purposes.
There are lots of small files in the MinIO storage. The iotop output is as follows:
iotop output
Total DISK READ :       8.36 M/s | Total DISK WRITE :     486.31 K/s
Actual DISK READ:       8.39 M/s | Actual DISK WRITE:     983.27 K/s
  TID  PRIO  USER     DISK READ  DISK WRITE  SWAPIN     IO>    COMMAND
15722 be/4 wf-inst     8.36 M/s    0.00 B/s  0.00 % 93.87 % metricbeat -c /opt/workfusion/metricbeat/metricbeat.yml
Steps to reproduce
Create too many small files in any subfolder of the installation folder.