
Platform Monitor overview
The document describes WorkFusion Platform Monitor and its features.
Features
Generally Platform Monitor has three functions:
- Application Platform Monitoring: monitor and troubleshoot the issues of WorkFusion components.
- Manage RPA.
- Maintain active RDP sessions.
- Environment Status: health status page with automated incident management.
- Components Statuses and Health Checks. Check system component health and important information about the component versions and licensees.
- Incidents: Check current incident timeline.
- Email Notifications of Incidents: Get notifications about incidents and their resolution to your email.
- Latest Data: Check the details of the component monitoring.
- Monitoring:
- Alerting and Notifications: Check specific metrics in time like CPU or HDD usage, availability of the components by the system.
- Proactive monitoring: Forecast the system resource usage (requires a separate configuration for usage).
- Metrics collection and storage.
- Command board: Manage the components (adhoc and scheduled).
- Bot management:
- Process management: Manage your RPA Processes.
- Control Panel (Bot management): Manage and monitor your RPA Bots.
Terminology
Platform Monitor
This is an application which collects, aggregates and processes information about WorkFusion components. PM Agents are installed on all WorkFusion servers for gathering required metrics.
Typically there is a main Platform Monitor instance which is responsible for aggregation of metrics from all servers, central management using web interface and heavy processing tasks (proactive monitoring)
- PM Server: Name of the server where the central Platform Monitor application is installed.
- PM Agent: Application installed on the servers of the WorkFusion ecosystem that collects metrics from particular components and sends to the central Platform Monitor.
Component group
All components are logically subdivided into groups. Examples of groups – Control Tower, WorkSpace, OCR, RPA, Databases, Machine Learning (VDS). These groups holds number of smaller services
Component
Part of a service stack. Can be a single or multiple system processes, a third-party service or WorkFusion applications
Incident
Representation of what is happening at the moment when a component is not in a healthy state
Alert
Internal object which is created when metric's value corresponds to preconfigured triggers (ex. “Response time” is large than 10 seconds). It is use to change components status and trigger arbitrary commands
Health check
A periodic check of the WorkFusion components via API and shown on the Components page.
Check
Periodic action which connects to some Data Source and evaluates retrieved data. Each check usually generates a set of metrics
Metric
The measurement of some component's characteristic. Metrics can be retrieved via API in JSON format. When MongoDB is installed it is saved for plotting graphs
Data Source
Defines some source which can be used to retreive metrics or status with checks.
Credentials
User and password pairs to be used in checks
Command
Arbitrary (but preconfigured) action which can be executed via API or UI to manage WorkFusion components. All command results are saved in history for tracking purposes
Process
Managed RPA (Bot) process which is started by WorkFusion Agent and tracked for status (automatically restarted upon failure). Process lifecycle can be managed vi API or UI. When primary process is restarted - all child processes are terminated too
Notification (Email)
Email notification of the Incidents via SMTP protocol.
Bot
Single RPA entity that is able to execute Bot Tasks.
Bot Relay
RPA Server deployment instance where a number of Bots are deployed.
Dependencies
Platform Monitor consists of the following components:
- Platform Monitor application (JAR file)
- JRE 8 runtime
- MongoDB (optional) 3.x. This is required on central Bot to display metrics history
Metrics collection
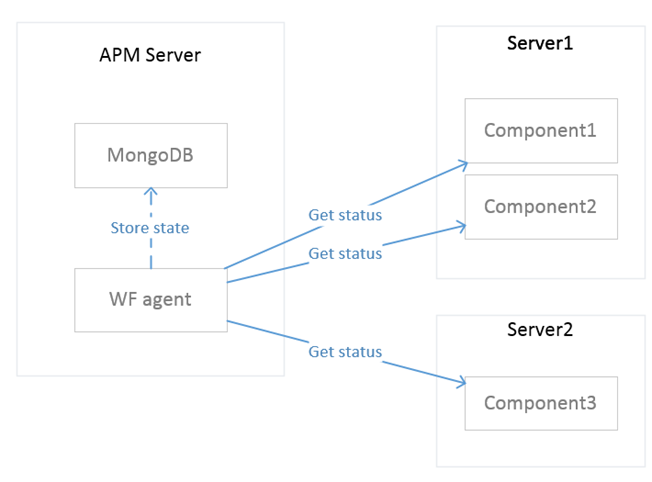
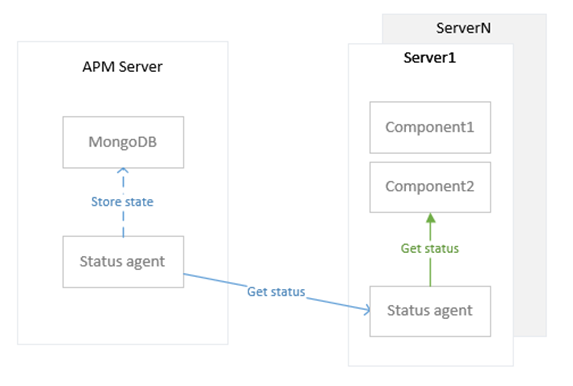
Metrics collection modes:
remote: Platform Monitor is collecting metrics using HTTP, SQL, Mongo interfaces from components located on remote servers.
local: Platform Monitor is installed on each server and can collect metrics using the Command interface.
Configuration
See the Platform Monitor configuration guide for up-to-date configuration details.