Business Process performance
Business Process Performance report displays detailed information about Business Processes runs. Business Process Performance report consists of several views: KPIs, Monitoring, Analytics and Comparative Analytics. These dashboards provide information about Business Process Performance with different levels of details.
Filtering
| Filter | Description |
|---|---|
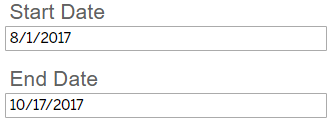 | Start Date, End Date: data in all views will be displayed for selected period only. |
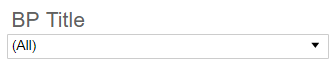 | Business Process title: upon selection all titles will display the results for selected items only. All, one or multiple Business Processes can be selected. |
 | This filter provides a possibility to choose the data for Production, Sandbox or both environments. |
 | Instance Status: upon selection titles are updated according to the selected statuses: |
 | This filter provides possibility to select Business Processes created by a defined User. |
KPIs
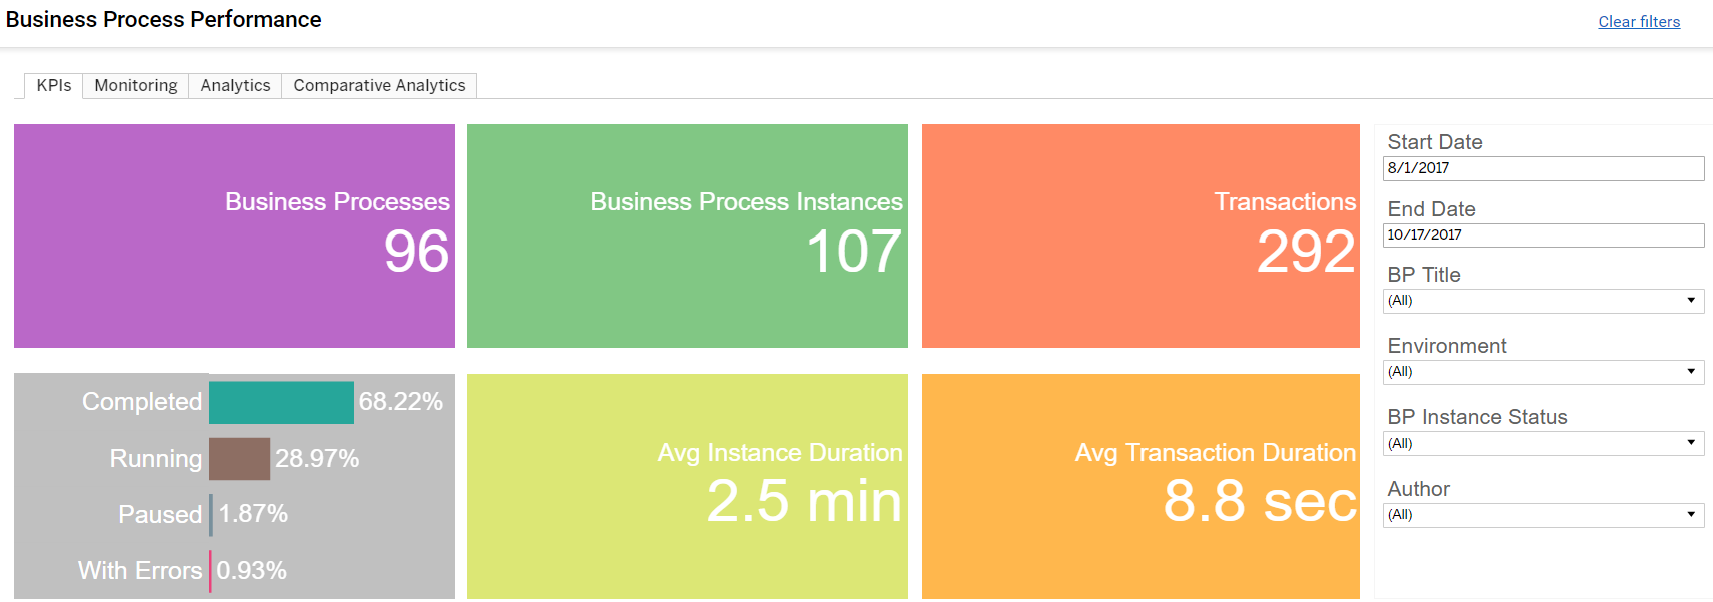
This view displays high-level indicators for Business Processes.
Business Processes
This tile shows the total number of Business Processes created within the selected period. The number of displayed Business Processes can be changed by selecting required Business Processes in the filter. All neighbor tiles also will be updated respectively to display data for the selected Business Processes only.
Instances
This indicator shows a number of Business Process Instances or, in other words, the sum of Business Process runs. Each Business Process can have zero or a few Instances.
Transactions
Transactions are the original items that are processed in the Business Process Instance. For example, transactions can represent Invoices, Tax Forms, Accounts, Insurance Claims or Checks.
Avg Instance Duration
Instance Duration displays the time required to process all transactions in the Business Process. By default, this amount is shown for all the Business Processes. Once a certain Business Process is selected in the filter, the Average Instance Duration displays the information for this Business Process only.
Avg Transaction Duration
Avg Transaction Duration is the time required to process the Transaction.
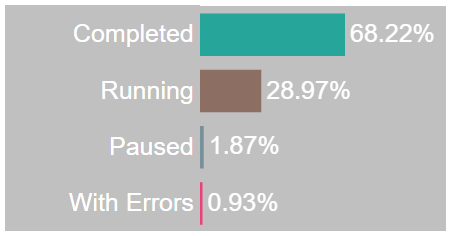
Statuses
This tile shows percentage of Business Process Instances in different statuses represented as bars. This tile can display the information for all Business Processes or a selected Business Process.
Monitoring
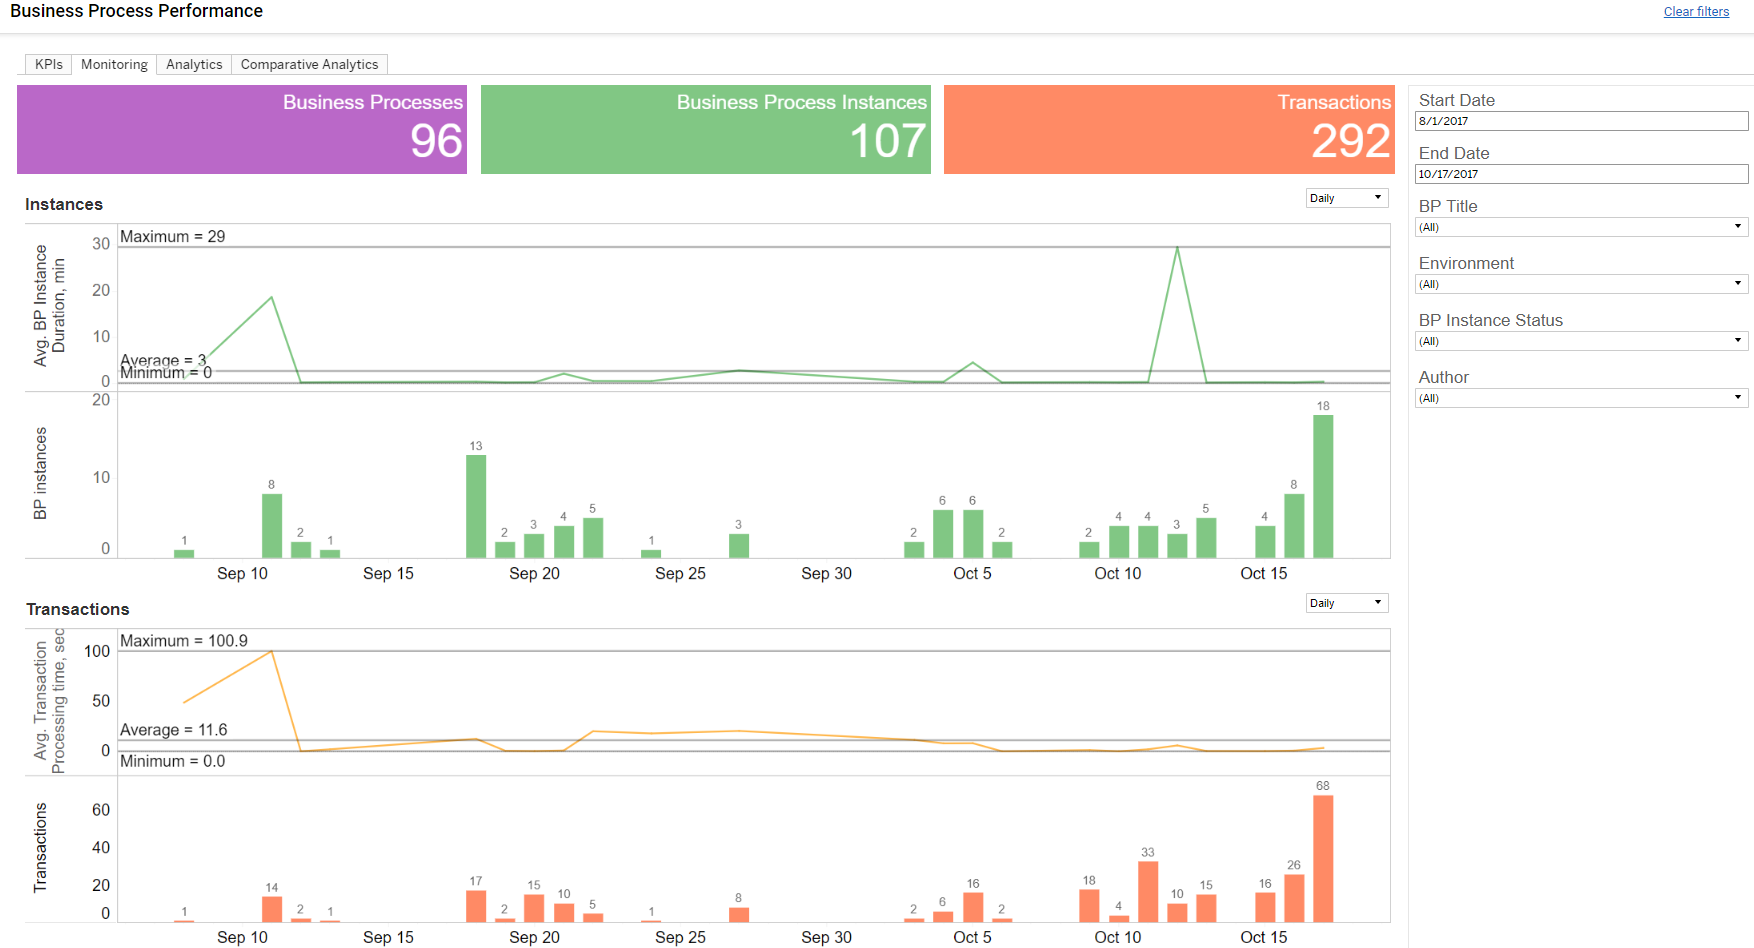
The following view shows dependencies between number of instances, number of transactions and time of instance duration and transaction processing time.
Instances
This sections shows a number of Business Process Instances and Average Business process Instance Duration against days/hours. Using Avg Instance Duration you can find the maximum, average and minimum values.
Transactions
This section displays number of Transactions and Average Transaction Processing Time by days/hours. Within Avg Transaction Processing Time you can find maximum, average and minimum values.
Let's make an example.
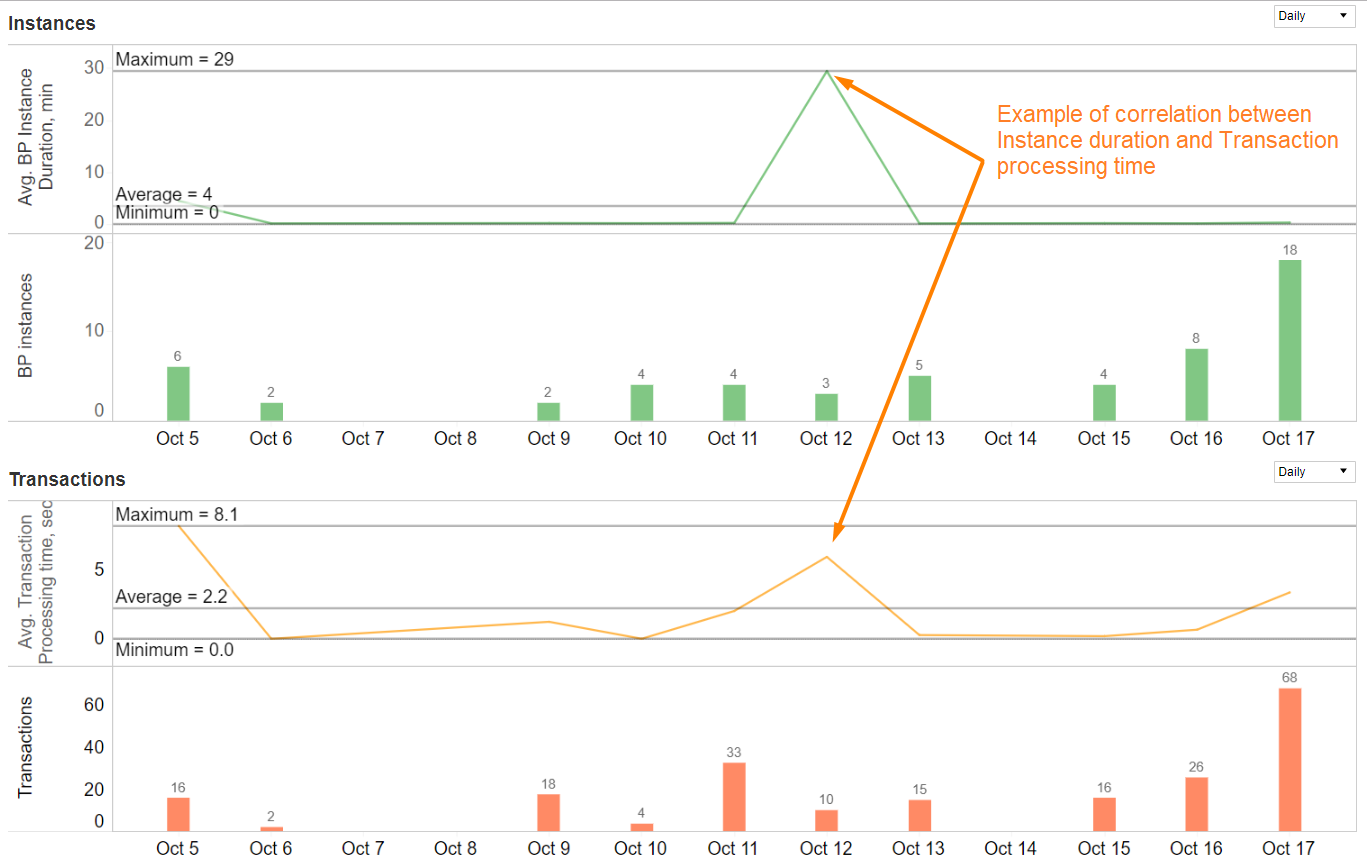
On the picture below we see a huge peak on "Avg BP Instance Duration" and an increase in amount of Instances on June 27. You can select the respective days on the Instance section to drill down into Transactions. The Transaction section adapts the period in accordance with that one selected on the Instance section.
At the same time, we see that number of Transactions is huge too and Transaction Processing Time increases on June 27 respectively. The same situations we see on June 19 and June 22. Though, the peaks in Instance Duration are not so high, but they are increased as compared to the neighbor days.
It means, the Instances Duration increase is caused by the number of Transactions.
Analytics
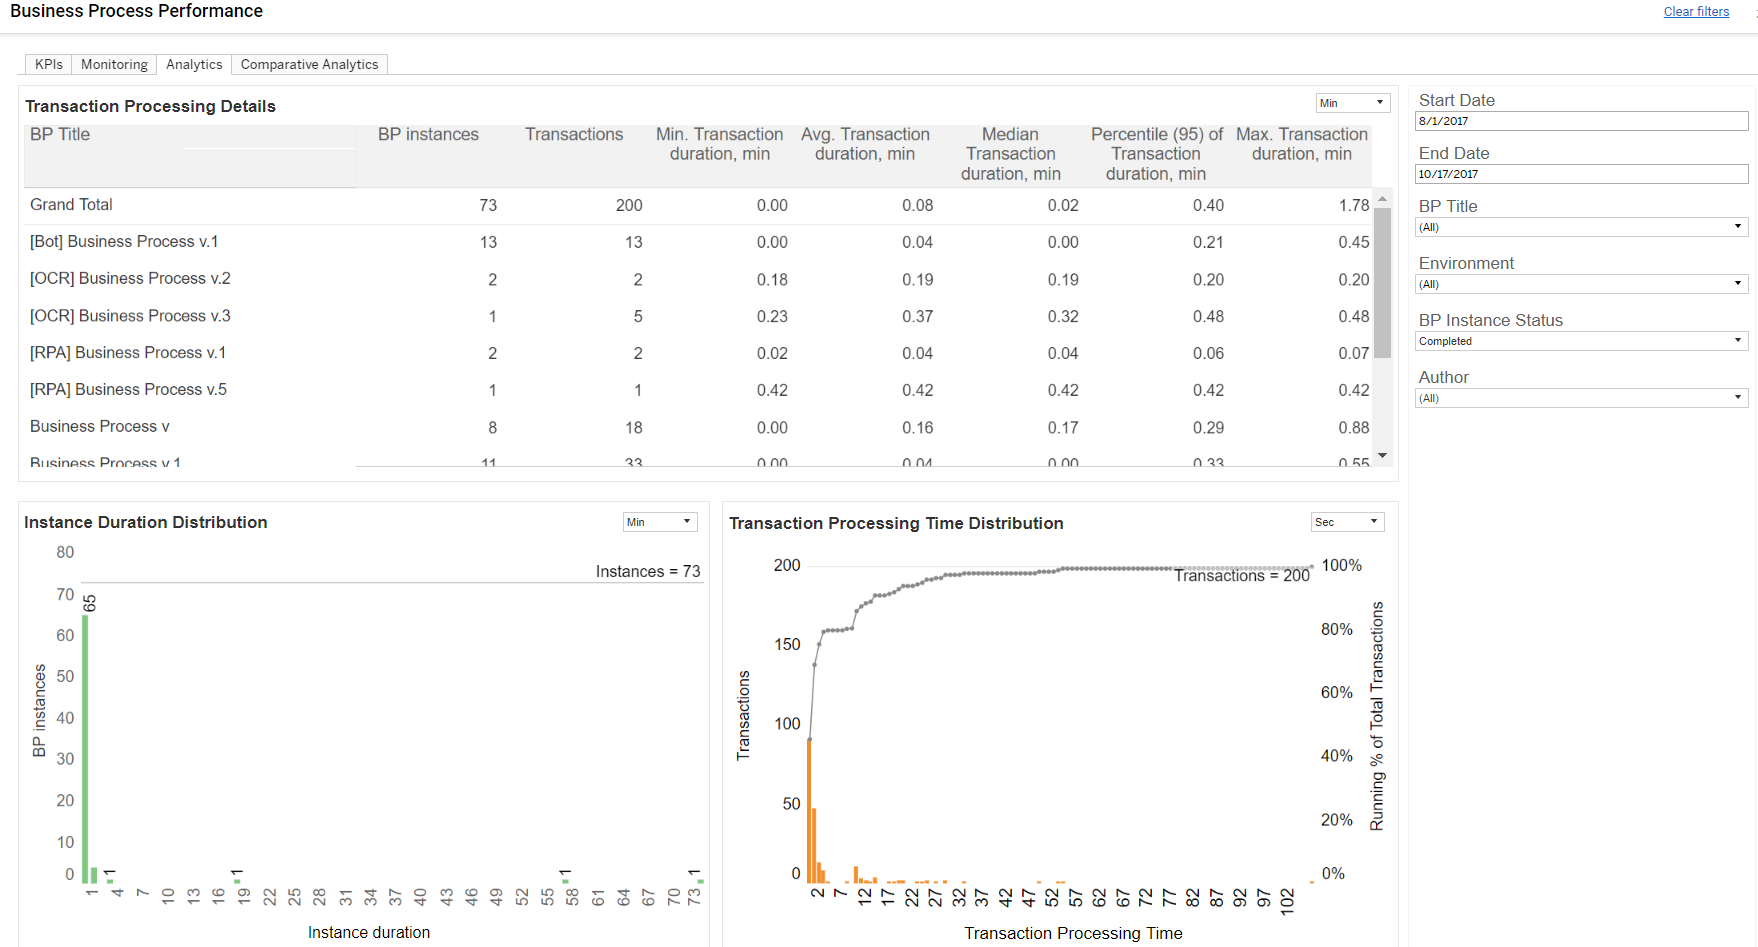
This view provides details about Transactions processing time.
Transaction Processing Details
Transaction Processing Details shows average, maximum, median, minimum and 95th Percentile processing time for transactions of specific business processes.
Instance Duration Distribution
This section shows the number of Instances with different Duration. On the picture above you can see that 12 Instances are processed in less than 1 minute, while 1 Instance has processing time equal to 1 minute.
Transaction Processing Time Distribution
In this section you can see how many Transactions are processed within specific time and cumulative percentage for all time slots. On the picture above you can see that 34 transactions are processed in less than 1 second, 10 transactions processed in 1 second and 4 transactions have processing time equal to 2 seconds.
Comparative Analytics
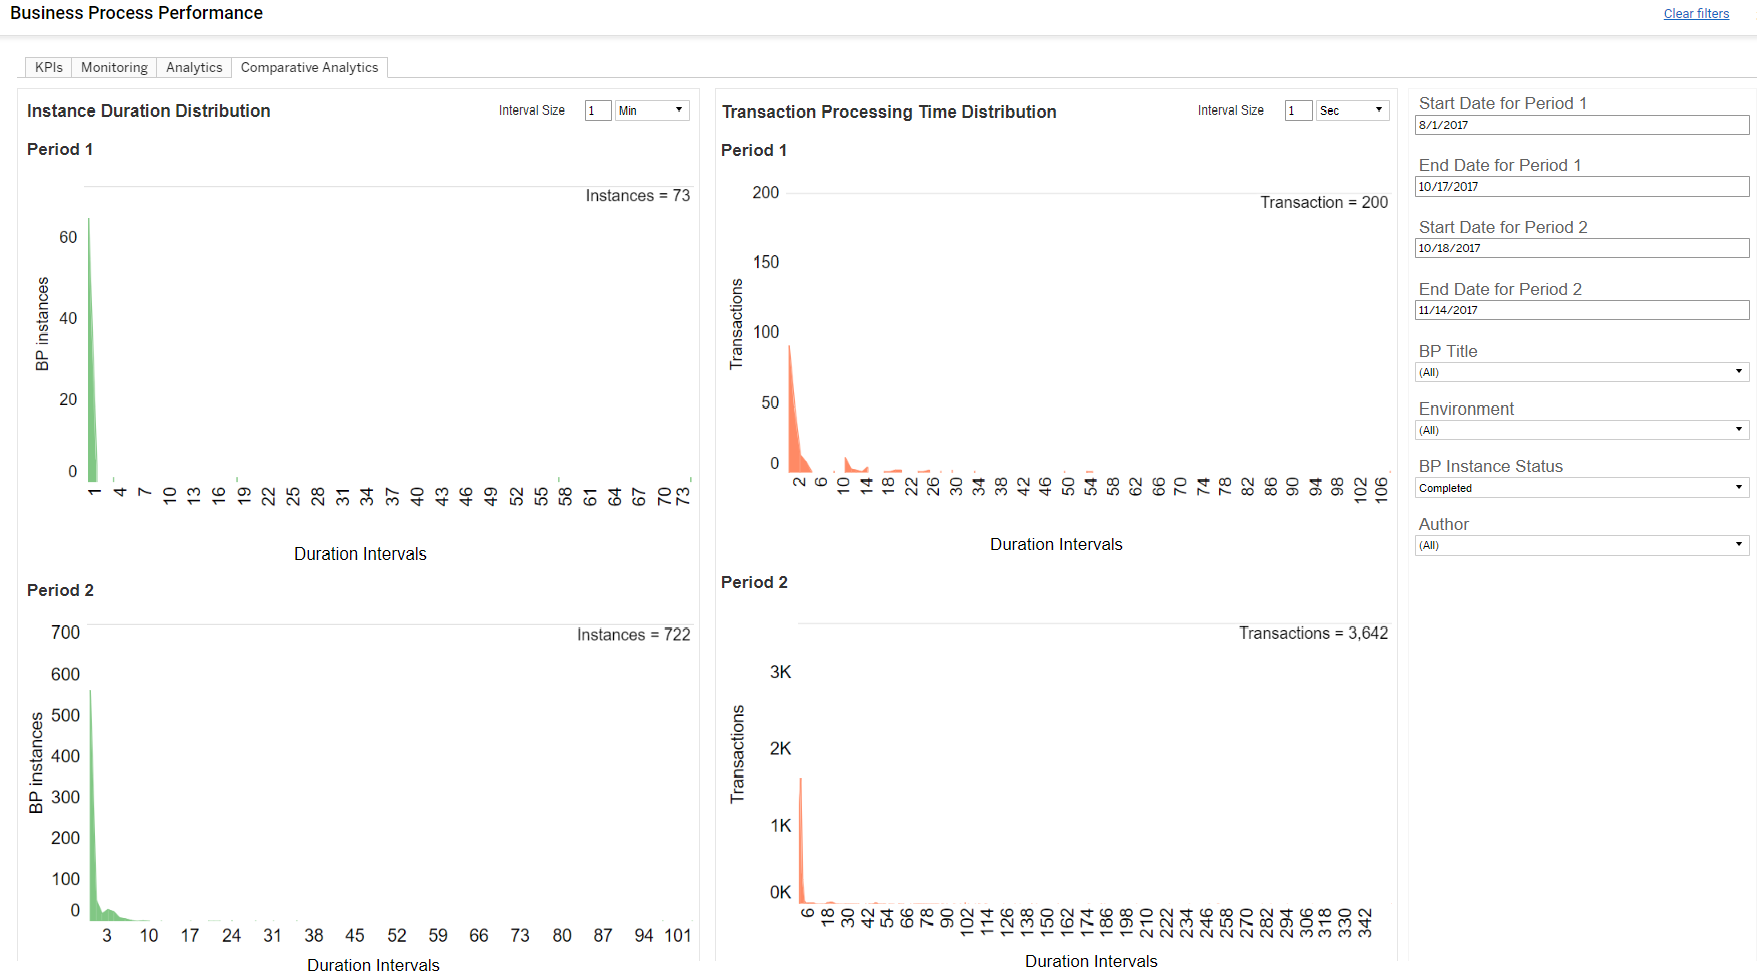
This view provides possibility to compare distributions of Instance Duration and Transaction Processing Time for two different periods. You can select Start Date and End Date for Period 1 to display the corresponding data in Instance Duration Distribution and Transaction Processing Time Distribution charts respectively.
Upon selection of Start Date and End Date for Period 2, you will see data for Period 2 on the charts.