
Task Level Performance
Task Level Performance dashboard displays detailed information about processing time and transactions in each task of Business Processes for the last 24 hours with different time levels. Additionally, Task Level Performance dashboard provides performance overview of tasks and instances for last N days both in general and with daily dynamics. Task Level Performance dashboard consists of several views: Tasks Overview and Selected Tasks, Completed Tasks and Completed Instances, Processing Instances.
Filtering
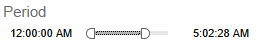
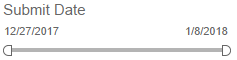
Time range is based on the transaction submission date.
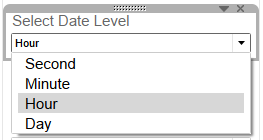
This parameter defines date level of time axis for the selected period of transaction submission date.
Business Process Title: once the selection is applied, the view will display the results for selected items only. All, single or multiple Business Processes can be selected.
Business Process Instance UUID: once the selection is applied, the view will display the results for selected items (UUIDs) only.
All, single or multiple BP Instance UUIDs can be selected.
Business Process Instance Status: once the selection is applied, the Business Process instances in the view are updated according to the selected statuses:
- Completed
- Paused
- Running
Task Title: once the selection is applied, the view will display the results for selected items (Tasks) only. All, single or multiple Tasks can be selected.

This filter provides a possibility to choose the data for Production, Sandbox or both environments.
Average Processing Time in seconds allows to filter the range of transaction processing time in each task.
Worker Type: once the selection is applied, the tasks in the view are updated according to Bot tasks, Manual tasks or both.
Time range is based on transaction submission date.
Average end-to-end Processing Time in seconds allows to filter the range of transaction processing time in each Business Process instance.
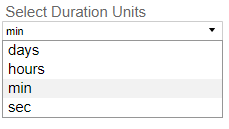
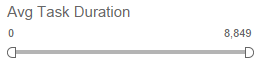
As Task Duration may be differ for different Business Processes processes there is a possibility to Select Duration Units for filtering Tasks by Average Task Duration.
This filter provides a possibility to choose.
Tasks overview
This view displays the overview of tasks performed in the last N hours (N=24 by default).
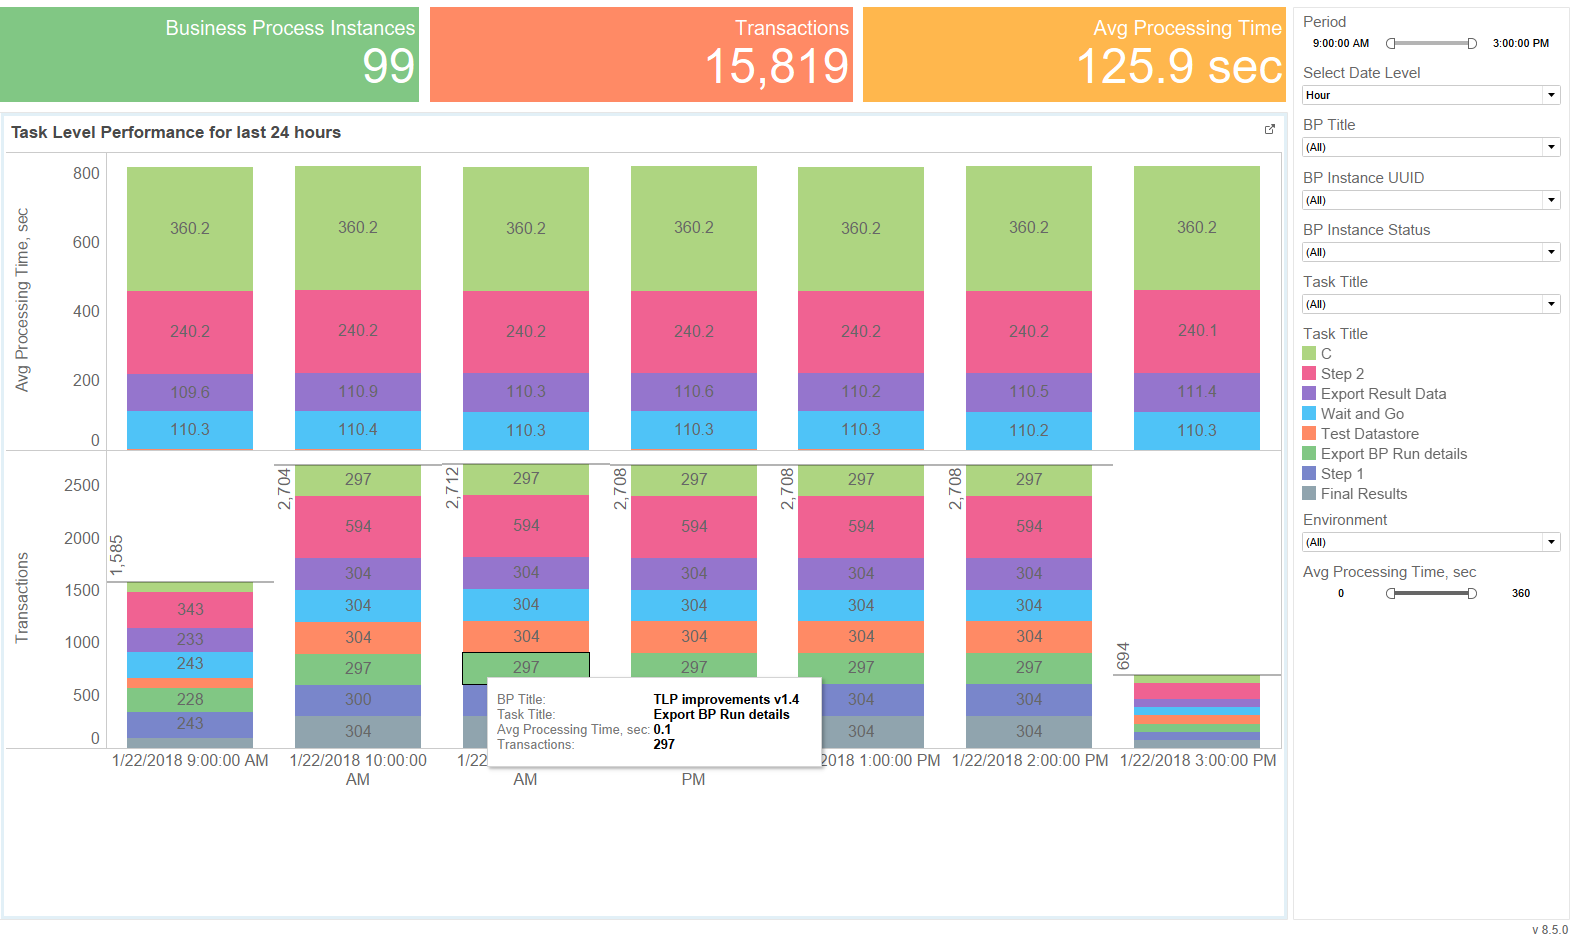
| Metrics | Description |
|---|---|
| Business Process Instances | This indicator shows a number of Business Process Instances or, in other words, the sum of Business Process runs. Each Business Process can have zero or a few Instances. |
| Transactions | Transactions are the original items that are processed in the Business Process Instance. For example, transactions can represent Invoices, Tax Forms, Accounts, Insurance Claims or Checks. |
| Avg Processing Time | Average Processing Time in seconds shows the average transaction processing time in each task. |
Average Processing time in seconds and Transactions processed in each task are displayed as stacked bar charts which helps finding a task with the longest transaction processing time or/and with the biggest/smallest number of processed transactions.
A user can select a specific task and drill down into details on the Selected Task tab.
Selected task
After selecting a specific task a user can see details about this step:
- Business Process Instances
- Avg Processing time, sec
- Transactions by Instances, where color in a stacked bar helps to see different business process instances whether they were performed one by one or simultaneously.
- BP instances helps to see how many instances were performed during the selected date level.
Completed tasks
The following view shows information about Bot and Manual tasks in each completed Business Process instance over last N days (N=7 by default).
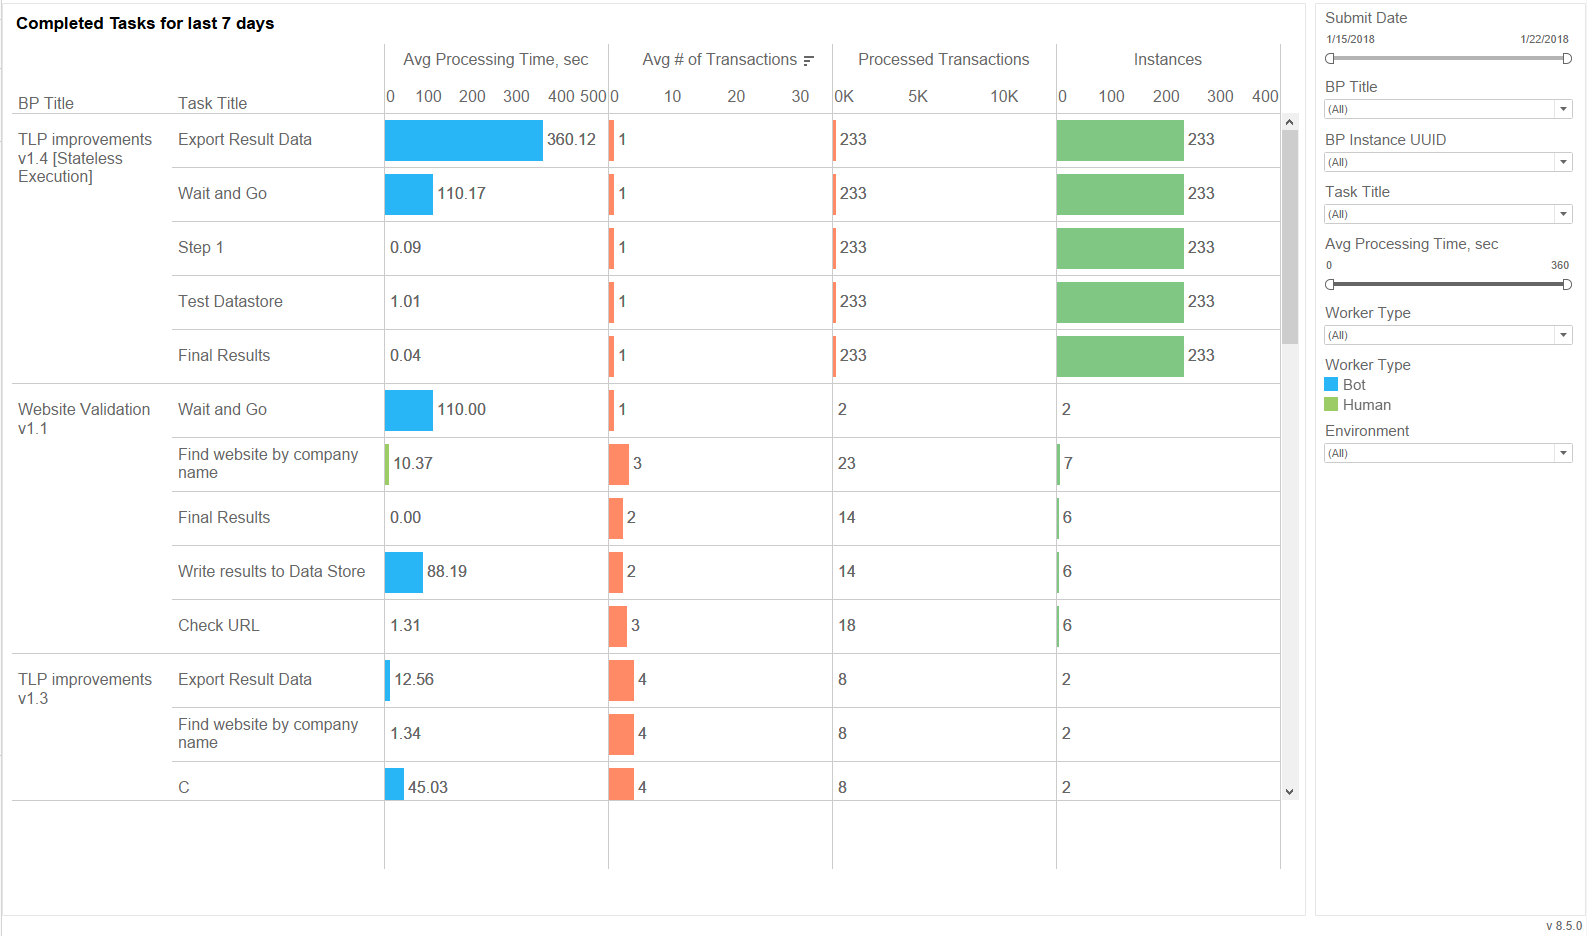
| Metrics | Description |
|---|---|
| Avg Processing Time, sec | Average value of transaction processing time in seconds in each task of Business Processes |
| Avg # of Transactions | Average value of transactions processed in each task of Business Processes |
| Processed Transactions | Total amount of processed transactions in each task of Business Processes |
| Instances | Total number of Business Process instances |
A user can select a specific Business Process and drill down into details on the Completed Instances tab.
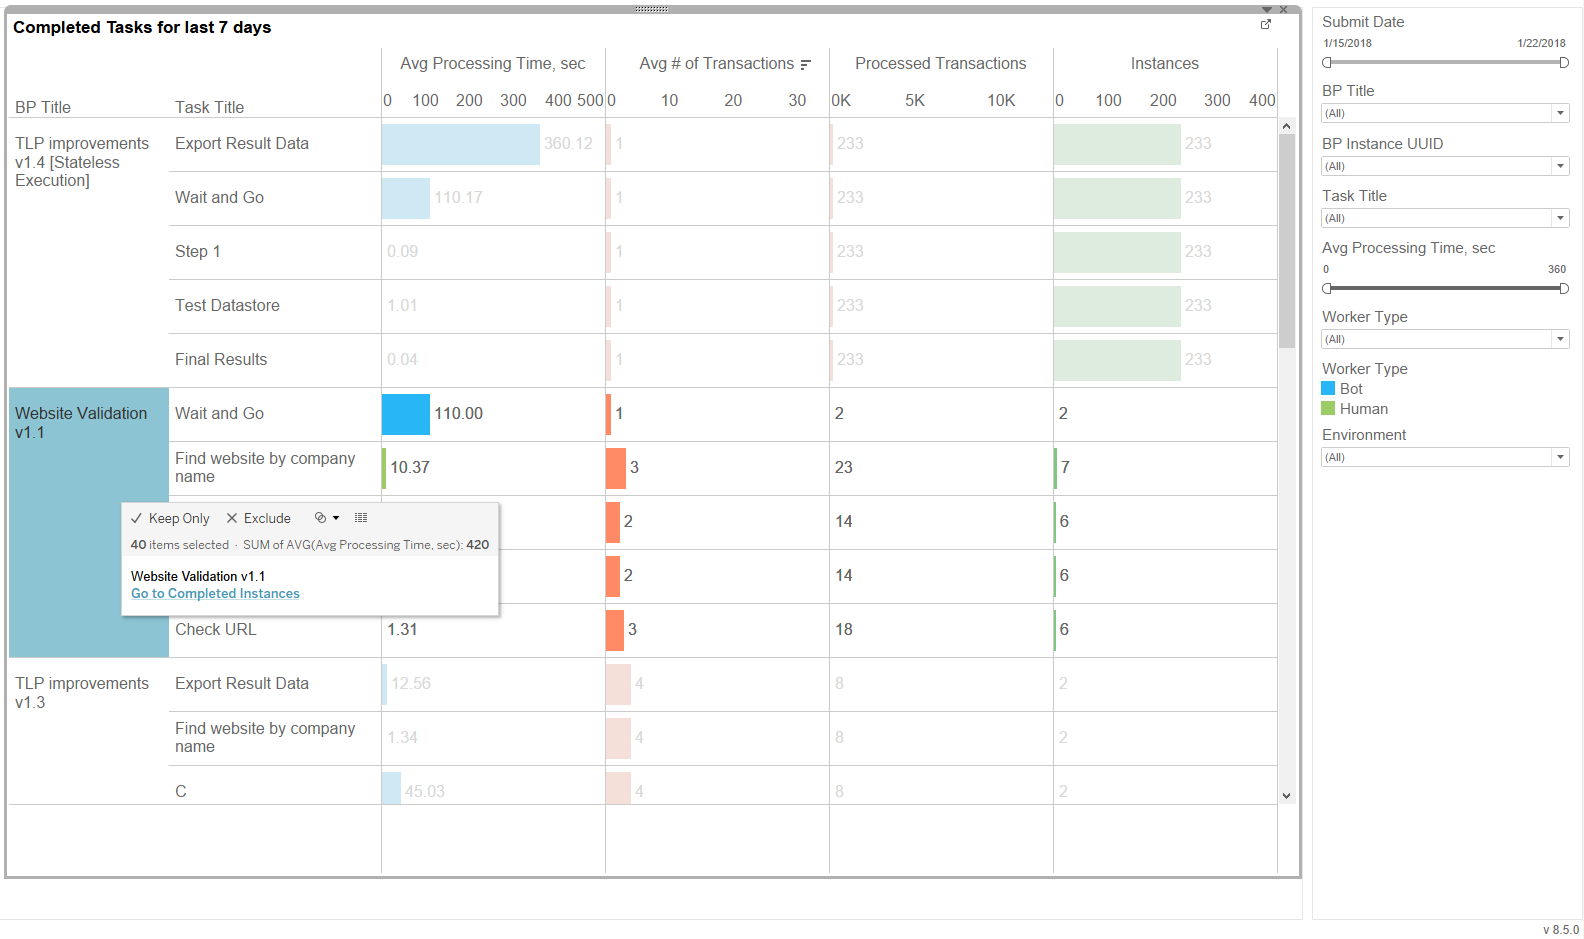
Completed instances
The following view shows information about completed Business Process instance over last N days (N=7 by default).
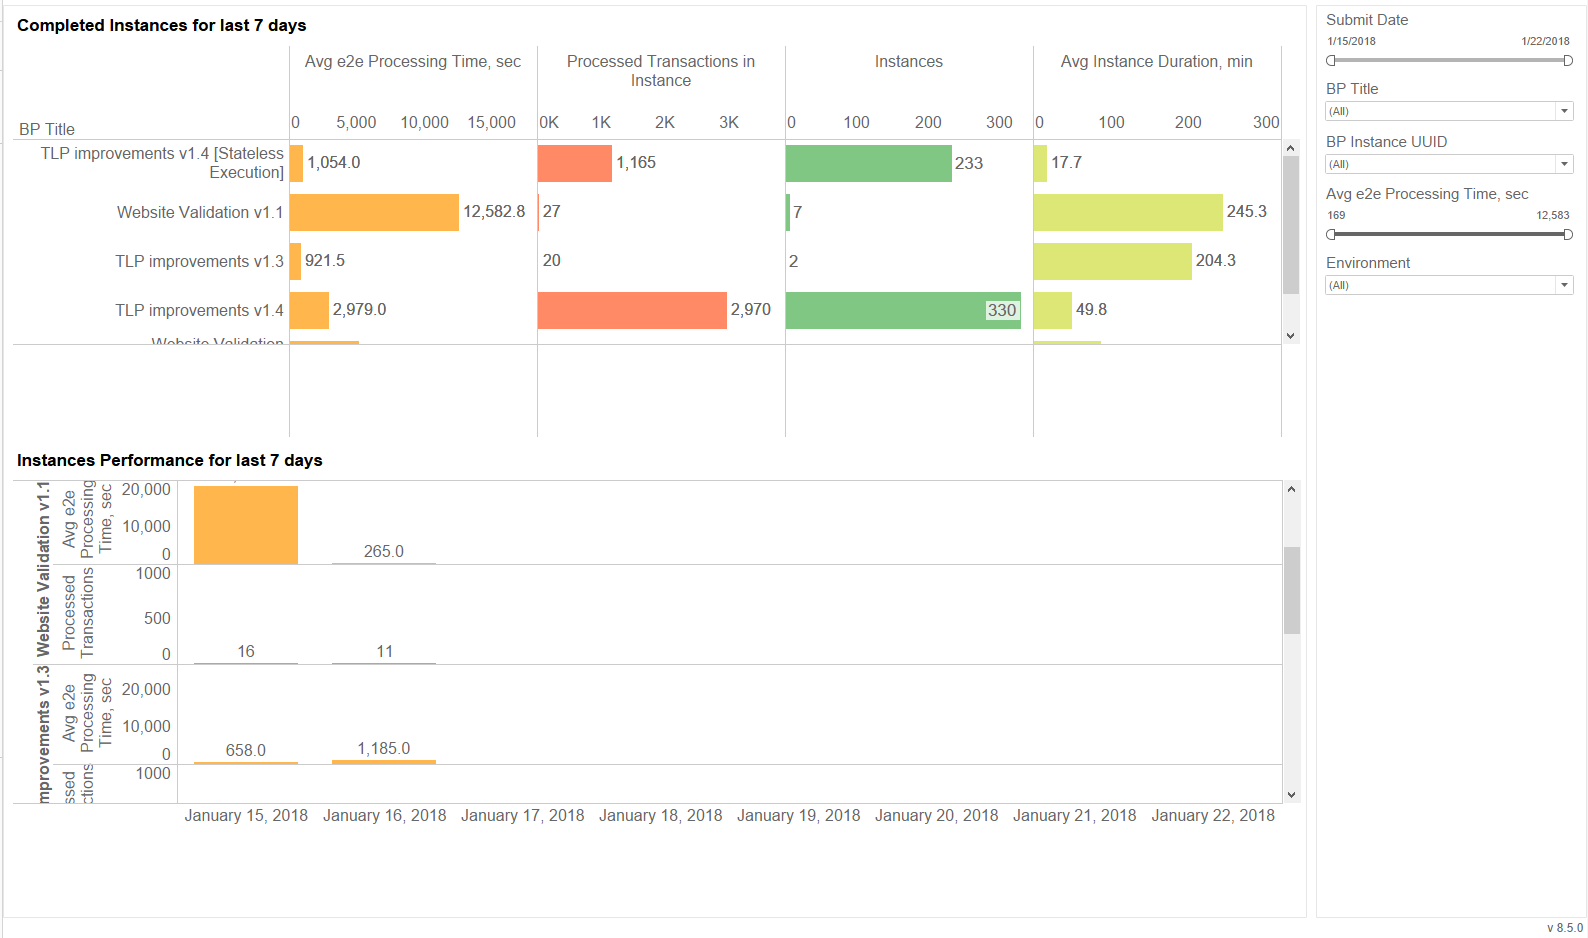
After selecting a specific Business Process on the Completed Tasks tab, see details about its instances:
| Metrics | Description |
|---|---|
| Avg e2e Processing Time, sec | Average value of transaction processing time in seconds from end to end in each instance of Business Processes |
| Processed Transactions in Instance | Total amount of processed transactions in each instance of Business Processes |
| Instances | Total number of Business Process instances |
| Avg Instance Duration, min | Average value of Business Process instance duration in minutes |
Processing instances
The following view shows information about processing Business Process instance over last N days (N=7 by default). Notes: for processing instances completed and processing tasks are displayed.
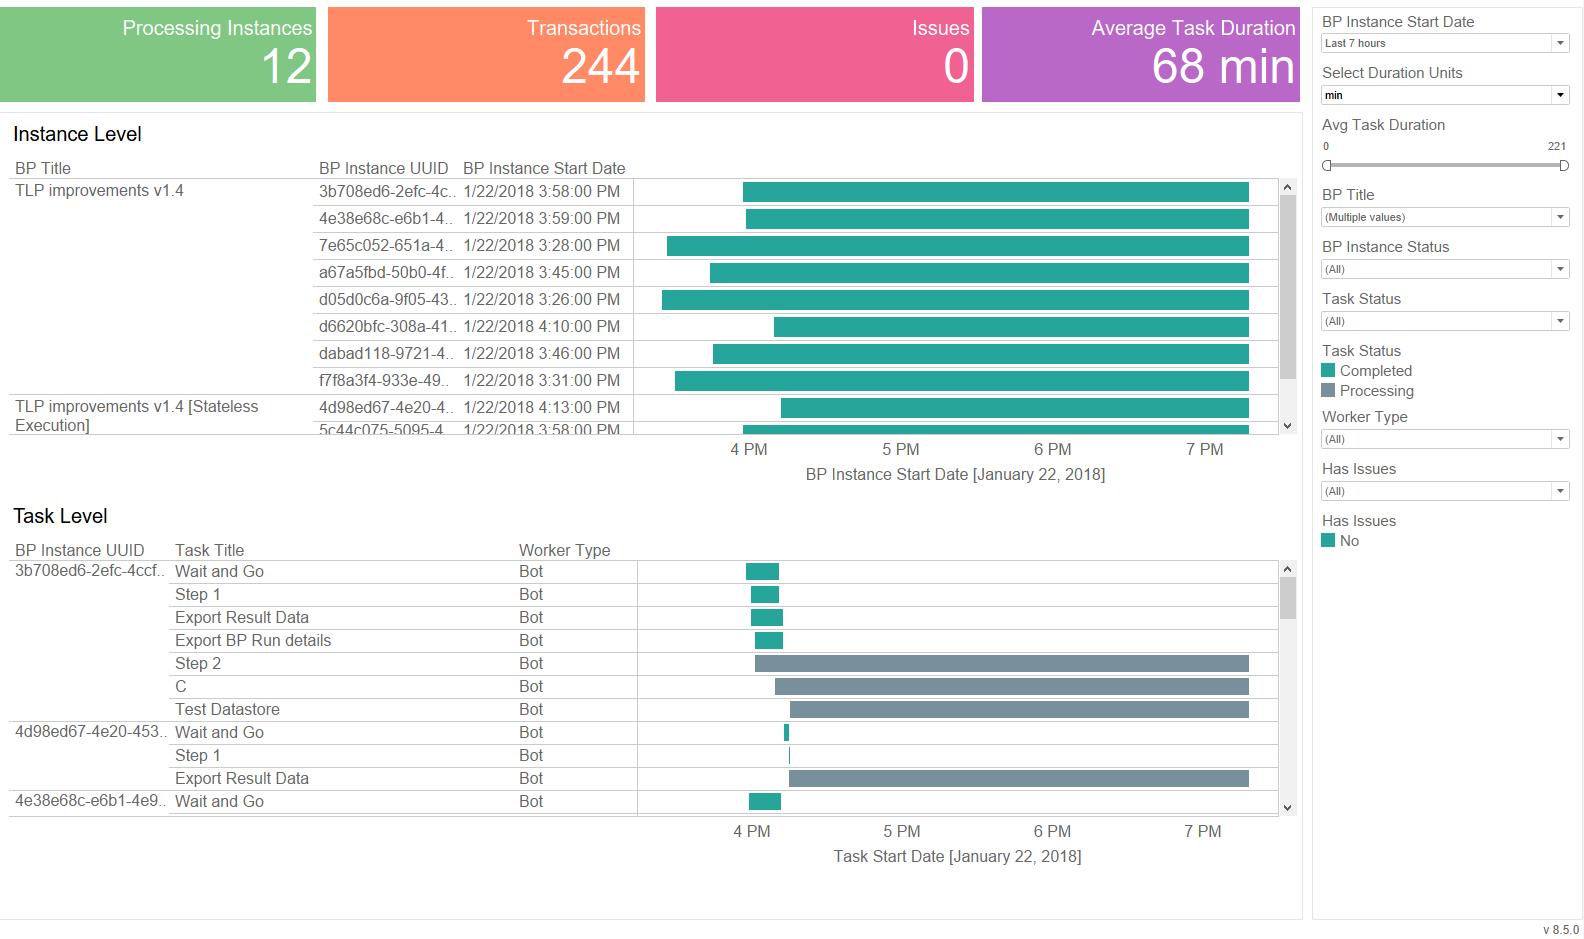
| Metrics | Description |
|---|---|
| Task Duration | Duration for a processing task is calculated up by the moment of last dashboard update. Duration for a completed task is calcaultated from start till end of a task. |
For Business Process Instances and Task Instances there is a possibility to open Design tab for a selected BP Instance or to Results tab for a selected Task Instance.