
Worker Portals Performance
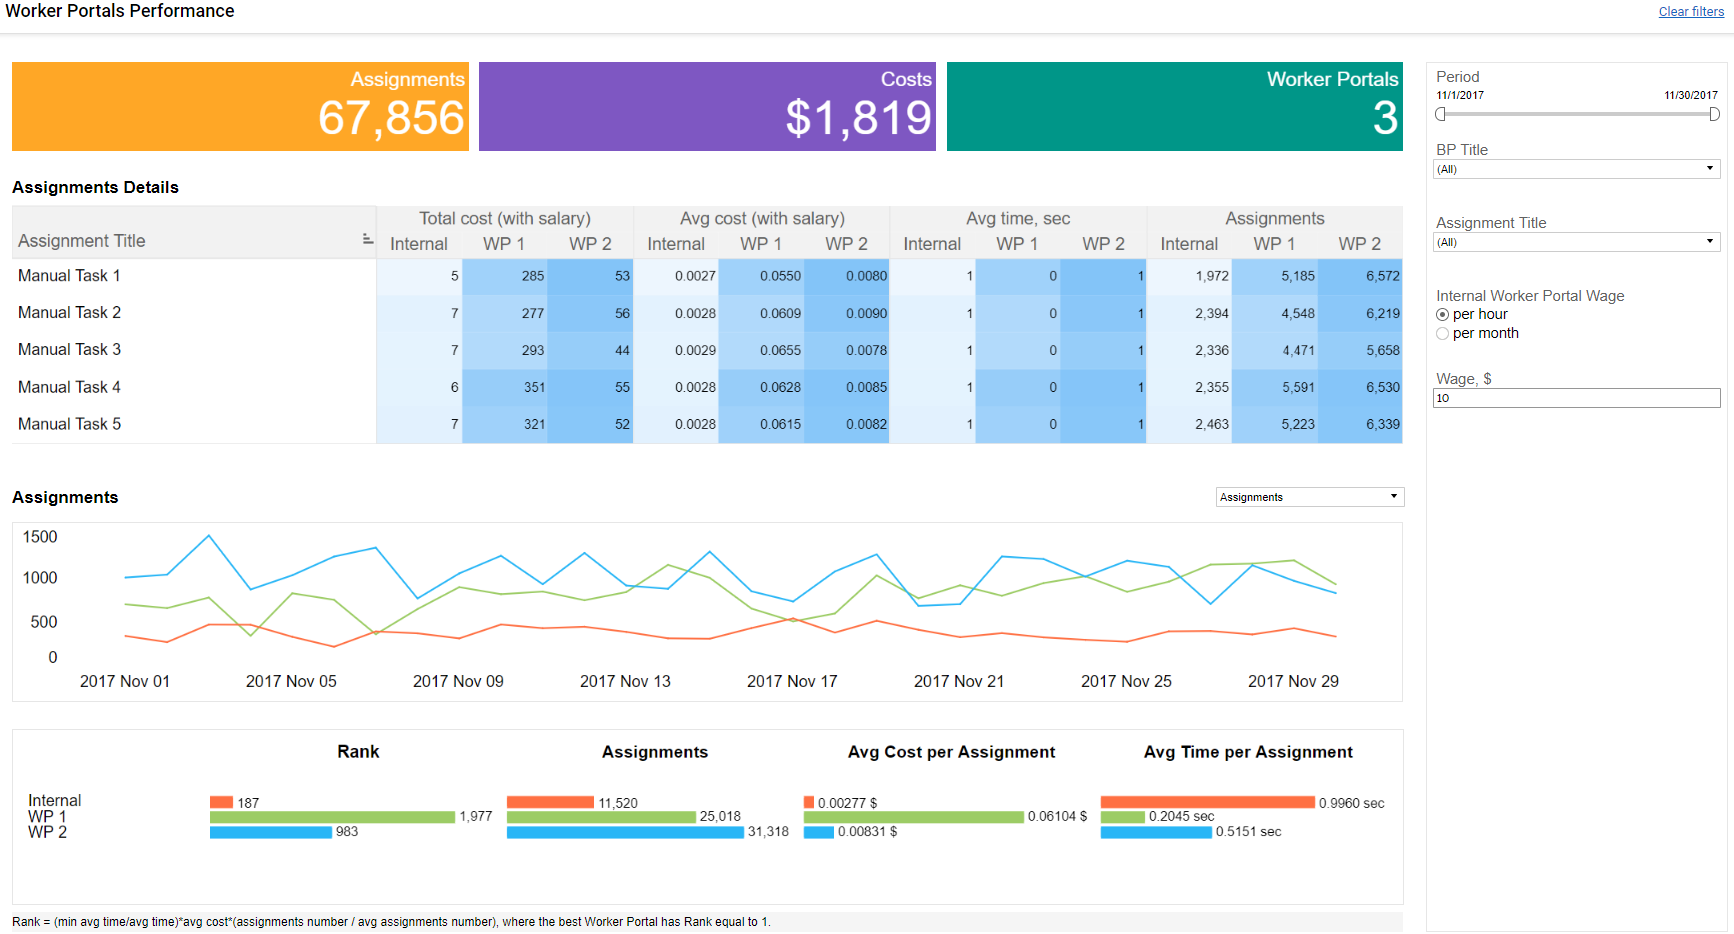
The Worker Portals Performance widget displays information about the performance of different Worker Portals and summarized data for all Crowds. The information is divided in several categories to provide comparison and indication of key performance metrics among the Workforce Providers, such as Rank, Number of Tasks, Average Cost and Time per Task. The metrics are used to calculate and show KPIs to analyze the quality of services from each Worker Portal.
Filtering
Dashboard can display different data depending on selected filter parameters. Filter settings selected below will be applied to all the widgets of Worker Portal Performance Dashboard.
Period slider allows to select certain time period.
Business Process title: upon selection all widgets will display results for selected items only. All, one or multiple Business processes can be selected.
Task Title title: upon selection all widgets will display results for selected items only. All, one or multiple tasks can be selected.
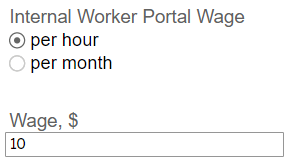
Internal workforce wage: you can select, whether hour or month wage should be applied to widgets.
Wage value, $: internal worker's wage amount.
Widgets
KPIs
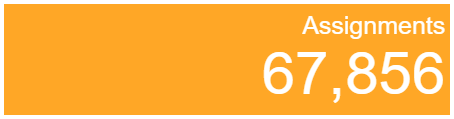
Assignments. The widget shows number of tasks submitted by workers for all Worker Portals.
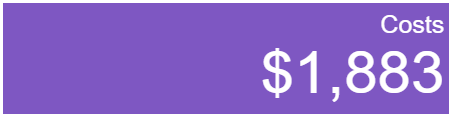
Total costs. The widget displays amount of money spent on workers salary for all assignments.
Worker Portals. The widget displays total number of Worker Portals.

Assignment details
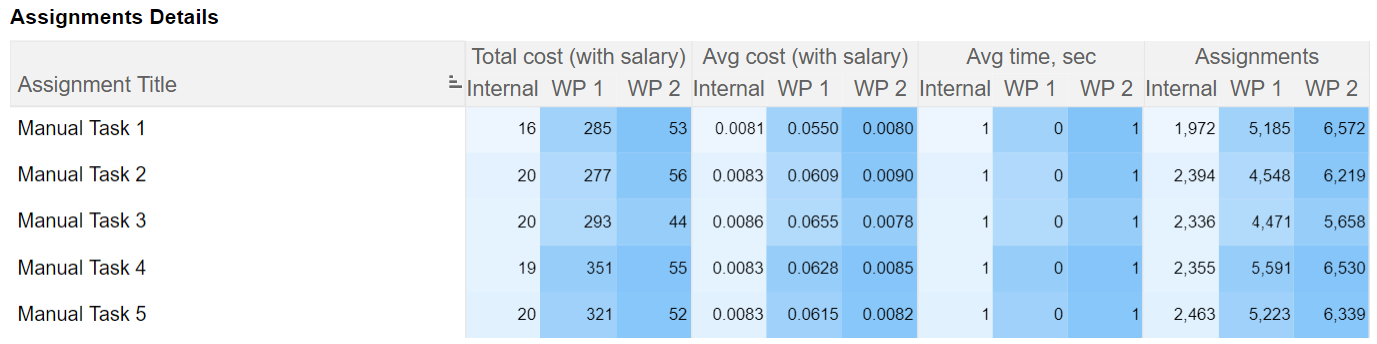
The following widget displays Assignment Details such as Total cost, Avg cost and Avg time.
Total cost reflects cost of execution for a group of identical assignments performed by Workers from a Worker Portal.
Avg cost displays average cost of one assignment execution performed by Workers from a Worker Portal.
Avg Time shows average time of one assignment execution performed by Workers from a Worker Portal.
Assignments, reflects total number of assignments executed by Workers from a Worker Portal.
Avg Time per Assignment
This widget displays average time of assignment execution by worker from each Worker Portal within the selected period.
- Y axis: Time in seconds
- X axis: Date
Using the following drop down list you can select a widget to be displayed. Each widget displays corresponding data for the selected period.

Avg Cost per Task
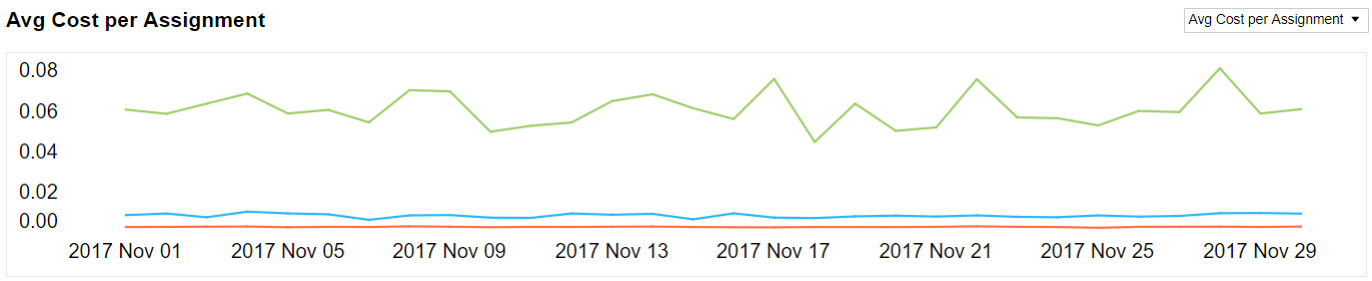
Using this widget you can view average cost per assignment executed by workers from each Worker Portal within the selected period.
- Y axis: Cost in $
- X axis: Date
Assignments
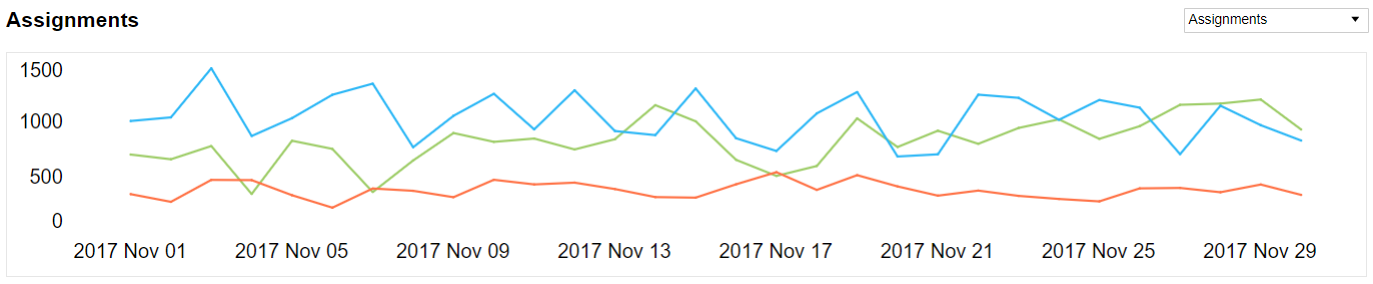
The following widget shows number of assignments submitted by workers from each Worker Portal within the selected period.
- Y axis: Number of Assignments
- X axis: Date
Rank
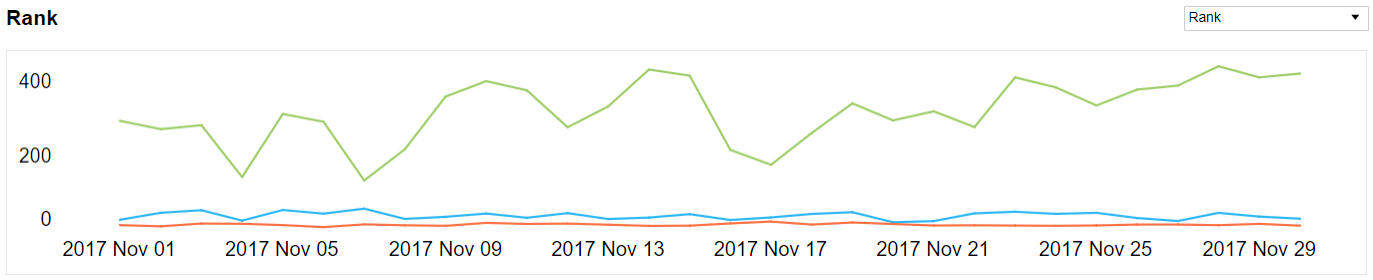
This widget displays rating of worker's efficiency for available Worker Portals on each date in the selected period.
The Rank is calculated by the following formula:
Rank = (min avg time/avg time)*avg cost*(task number / avg total tasks number)
The best Worker Portal has Rank equal to 1.
- Y axis: Rank number
- X axis: Date
Aggregated widgets
The following widgets display aggregated data per selected period:
Rank
note
- At the top of the list: the most efficient Workforce Provider.
- At the bottom: Workforce Provider with the lowest level of worker efficiency.
Assignments
Avg Cost per Assignment
Avg Time per Assignment