
View Dashboards
Dashboard is a reporting mechanism that aggregate and display metrics and key performance indicators (KPIs). Dashboards help improve decision making by revealing and communicating in-context insight into business performance. A dashboard consists of one or more charts, tables, numeric metrics. Dashboards are displayed at main page of Control Tower—the Dashboard page.
By default, it is the first screen you see after logging in to the WorkFusion platform. It provides a high level overview of all components.
Dashboards are interactive and can respond to hovering over and clicking.
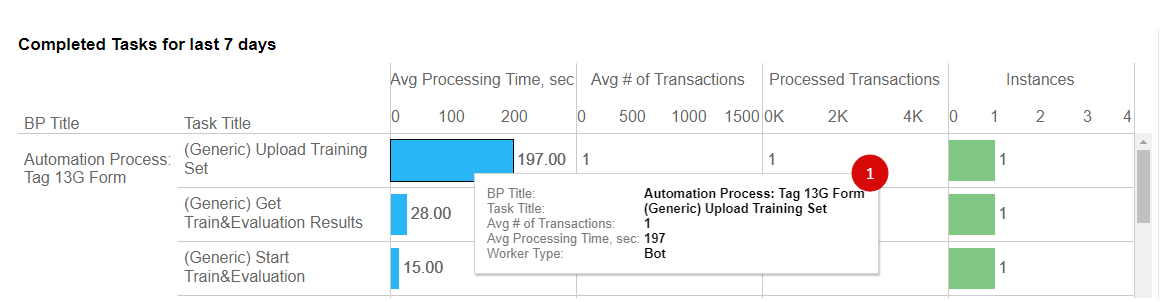
Dynamic tooltips appear when you hover over different chart points and contain X and Y axis values and description.
Dashboards charts are clickable. You can select certain points, stripes, areas, and so on.
The dashboards are as follows: