
RPA Performance
The RPA Performance dashboard displays detailed information about RPA tasks executions and RPA bots workload. RPA Performance dashboard consists of several views: RPA Tasks Overview, Bots Overview, Sessions Distribution and Sessions Details. These dashboards provide information about RPA Performance with different levels of details.
Filtering
Start Date of a RPA session: data in all views will be displayed for selected period only.

Business Process Name: upon selection all titles will display the results for selected items only. All, one or multiple Business Processes can be selected.
Business Process Execution: upon selection all data will display the results for selected items only. All, one or multiple Business Process Executions can be selected.

RPA Task Name: upon selection all titles will display the results for selected items only. All, one or multiple Business Processes can be selected.
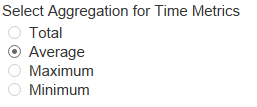
Select Aggregation for Time Metrics: a switcher between average, total, minimum and maximum for Execute and Wait time values.
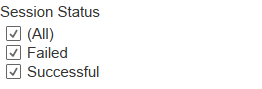
Session Status: upon selection sessions are updated according to the selected statuses.
KPIs
| Option | Description |
|---|---|
| RPA Tasks Processed | Total number of RPA tasks processed for selected period of time. |
| Engaged Bots | Number of bots engaged in processing RPA tasks records. |
| Successfully Completed Rate | Successfully completed rate shows the number of successfully completed bot sessions for processing records within RPA tasks. |
| Processing Time, sec | Processing time (in seconds) shows how long it takes to process all records within RPA task. |
| Bot Utilization Rate | Bot utilization rate shows the average percent of bot being utilized over time. |
| Execute Time, sec | Execute time (in seconds) shows how long it takes a bot to execute a session. You can switch between average, total, minimum and maximum by using 'Select Aggregation Level' parameter. |
| Wait Time, sec | Wait time (in seconds) shows how long it takes to initialize a bot. You can switch between average, total, minimum and maximum by using 'Select Aggregation Level' parameter. |
Views
- RPA Tasks Overview: The following view shows high-level statistics on RPA task level.
- Bots Overview: The following view shows high-level statistics on Bot level.
- Sessions Distribution: The following view shows how evenly sessions are distributed among bot relays including session statuses breakdown.
- Sessions Details: The following view shows a flow chart for bots workload and summary for failed sessions.