Worker Performance
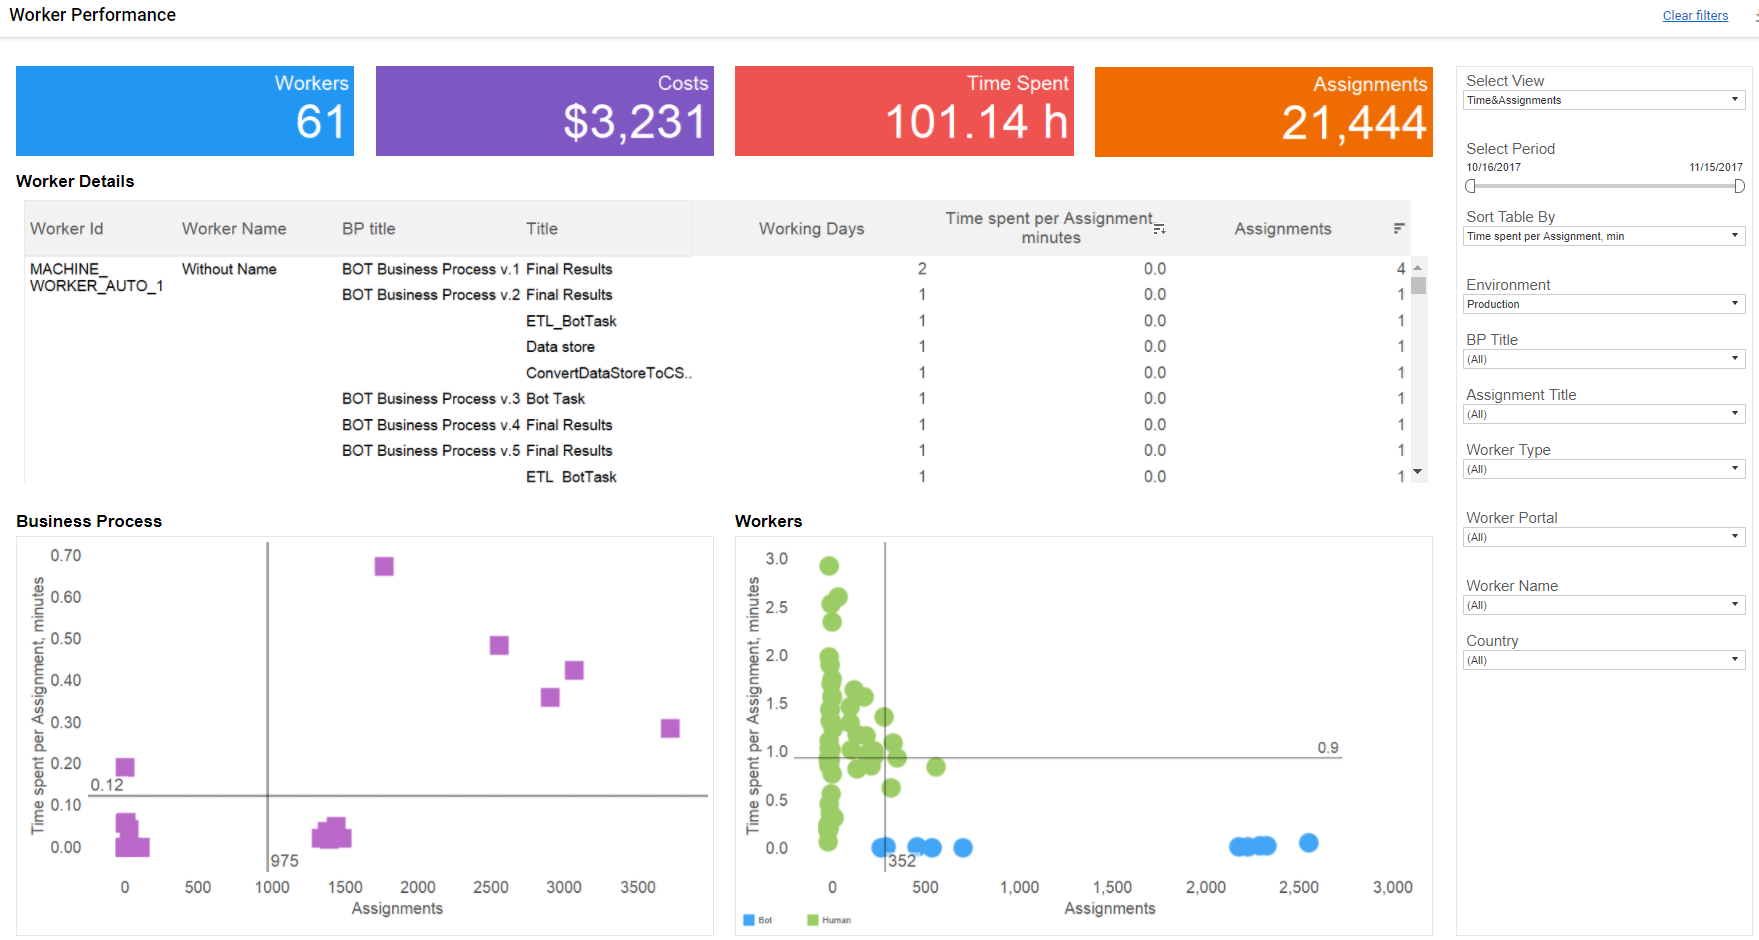
The Worker Performance widget displays the summarized information about effectiveness of workers in terms of Business Processes, Tasks, Working days, Assignments and Time spent per assignment; trend for assignment in Business Process and Workers/Bots ratio in completion of the assignments.
Filtering
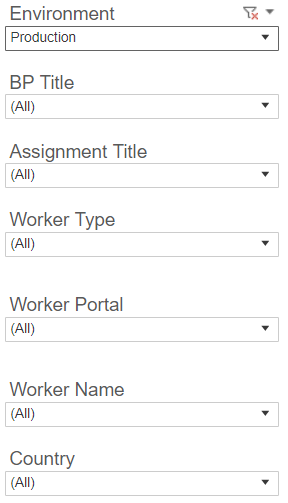
Dashboard can display different data depending on selected filter parameters. Filter settings will be applied to the widgets of Worker Performance Dashboard.
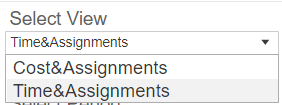
Worker Performance widgets can be broken down by the Costs and Assignments or Time and Assignments data. This filter updates all widgets except Totals: Time Spent, Assignments, Workers, and Costs.
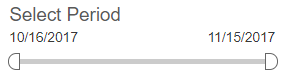
Period slider allows to select certain time period.
Production or Sandbox Environments can be selected.
BP Title shows results for selected Business processes only.
Assignment Title display results for selected tasks only.
Worker Type allows to filter widgets by type of worker - Human or Bot.
Worker Portal displays data for workers that belong to specific Worker Portal.
Worker Name displays results for selected workers only.
Country allows to filter widgets by country of origin of workers. For each of the filter above - all, one or multiple items can be selected.
Widgets
Worker details
The widgets shows details about time and costs spent by specific workers on execution of certain business processes and tasks.
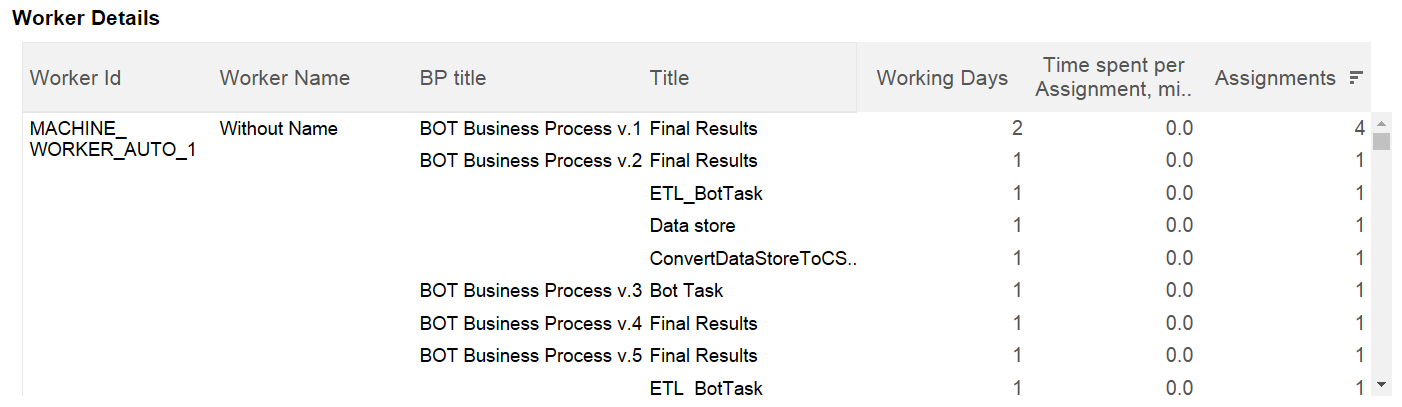
If the Cost and Assignments option is selected in the Select view filter, the Costs column appears in Worker Details widget. If the Time and Assignments option is selected in the Select view filter, the Cost column is replaced with the Time spent per Assignment, min column.
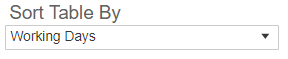
The Sort Table By filter (within filters column) allows to sort the widget. Once the sort option is chosen, the information in the widget is grouped by workers, business processes and run titles respectively. Sorting options are:
| Option | Description |
|---|---|
| Assignments | Workers are sorted by a number of executed assignments for all business processes. |
| Spent time per Assignment, min | Workers are sorted by the time spent on assignments completion. |
| Number of Working Days | The sorting order is performed according to the number of days when worker executed specific task. |
| Costs | Workers are sorted by costs spent to pay the worker for completed assignments. |
When you hover the cursor over numeric values on the widget, a tool tip will appear showing details about the specific task. The details include information about Bonus, Liability and Reward received by worker for the task.
Totals
These widgets display aggregated information of the following indicators for the selected period:
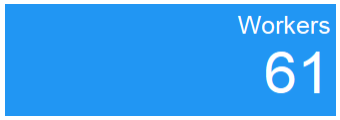
Workers. The widget shows number of workers who completed assignments during the selected period.
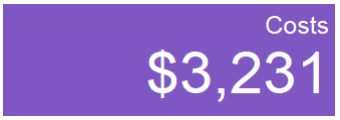
Costs. Amount of money spent on workers' salary for assignments submitted during the selected period.
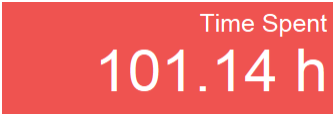
Spent Time. The widget shows total time spent by workers.
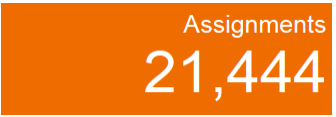
Assignments. The widget shows total number of assignments completed by workers.
Business Process
This widget displays number of assignments by business processes and time spent for assignment execution for a selected period.
Y axis: Spent time per Assignment, min.
X axis: Assignments.
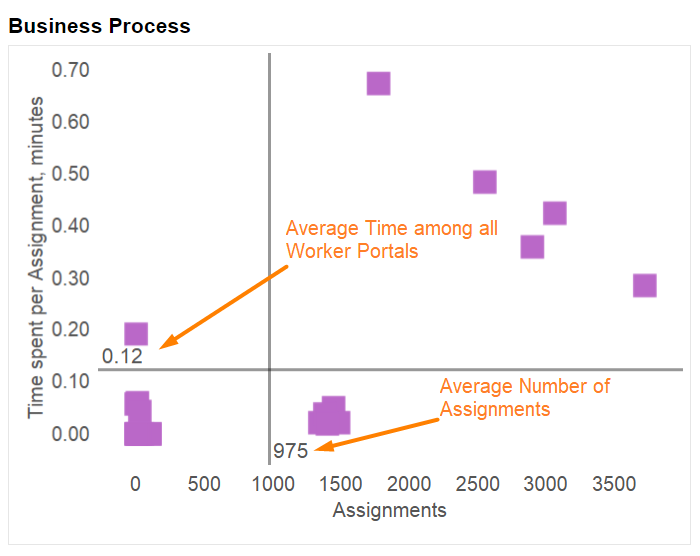
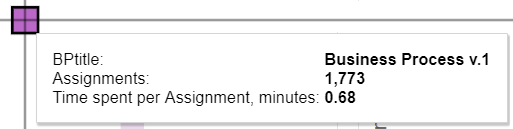
If you hover the cursor over a dot, a tool tip appears showing the following information: BP Title, Number of Assignments and Time Spent.
Workers
This widget shows the number of assignments submitted by workers for a selected period and the time spent per assignment in minutes.
- Y axis: Spent time per Assignment, min.
- X axis: Assignments.
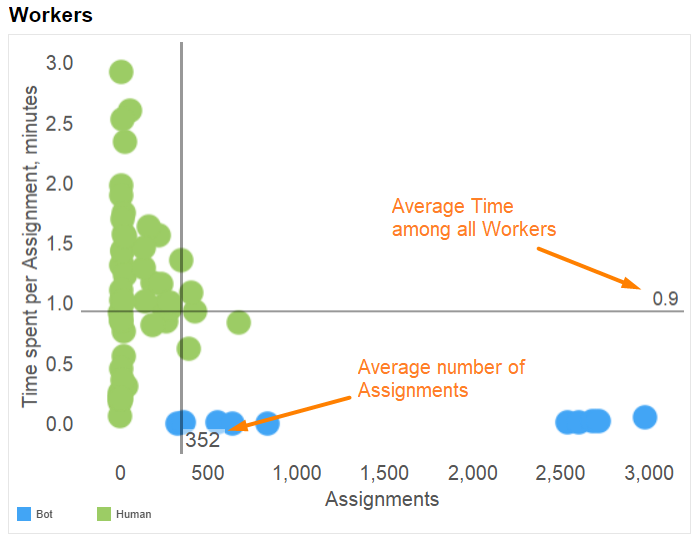
The blue dots represent the bot workers results. The green dots indicate human workers results.
On the widget above you can see, that overwhelming majority of human workers submitted less than 500 assignments, while almost all bots - more than 500 assignments, and about a half of bots submitted more than 2 500 assignments.
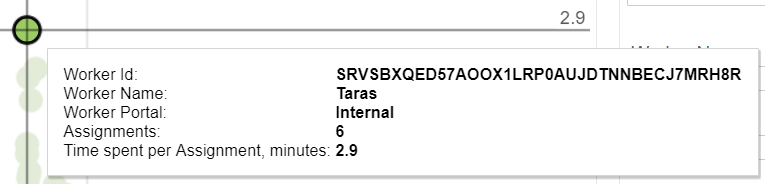
When you hover the cursor over a dot, a tool tip appears showing detailed information including Worker Id, Worker Name, Worker Portal, Assignments and Time Spent per Assignment, min.