Bot Performance
The Bot Performance report provides information about steps in Business Processes executed by Bots and consists of two parts: KPIs and Monitoring.
KPIs
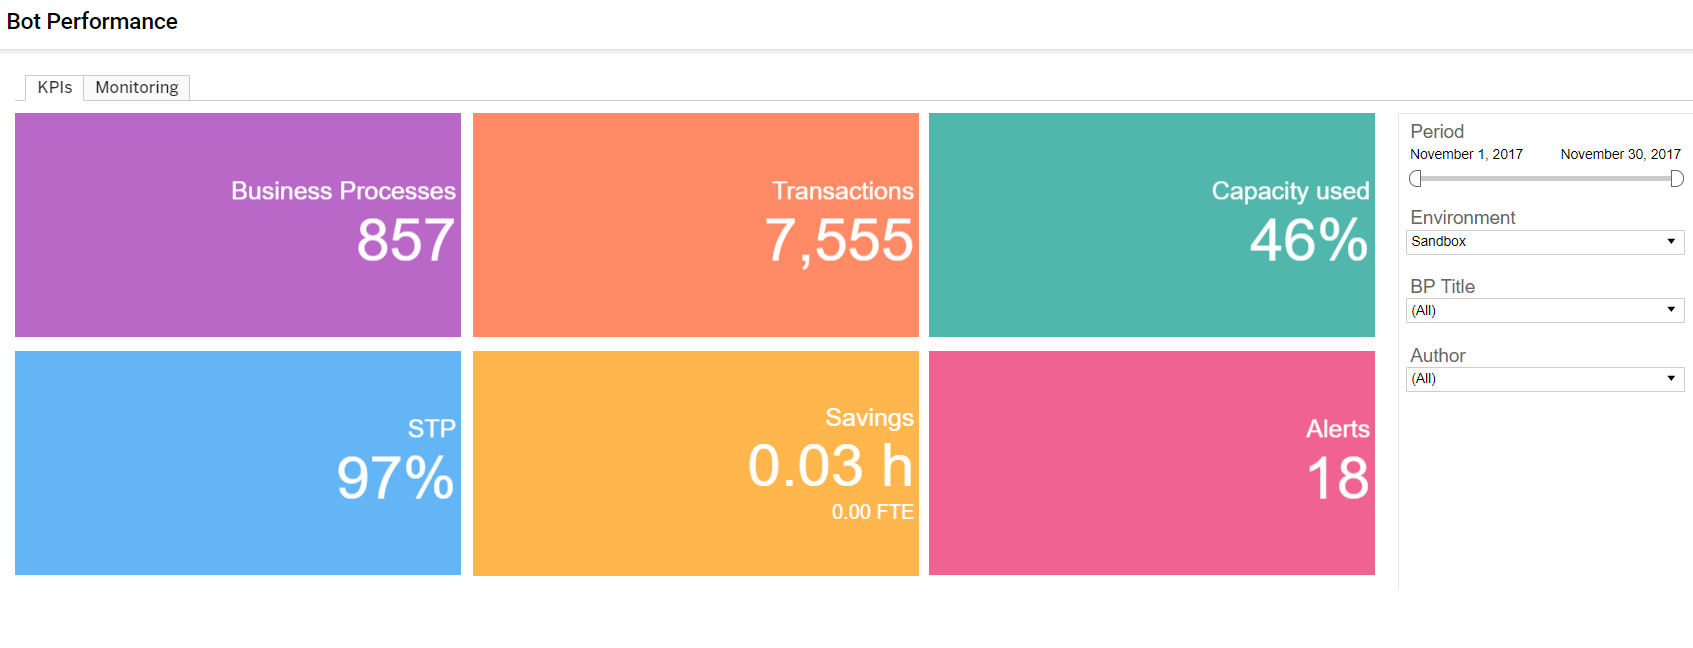
Business Processes
This tile shows the total number of Business Processes created within the selected period. The number of displayed Business Processes can be changed by selecting required Business Processes in the filter. All neighbor tiles also will be updated respectively to display data for the selected Business Processes only.
Transactions
Transactions are the original items that are processed in the Business Process Instance. For example, transactions can represent Invoices, Tax Forms, Accounts, Insurance Claims or Checks.
Capacity used
Capacity is a relative index reflecting the ratio between the average amount of transactions processed and the maximum number of processed transactions within the selected period.
STP
Straight Through Processing (STP) shows the ratio of Transactions that fully processed by Bots (each of Business Process is processed by Bot) to the total amount of Transactions (Transactions that processed by both Bot and Human). The higher STP percentage is, the better Business Processes are automated.
Savings
Savings are represented in hours and Full-time Equivalent (FTE). The hours provide information about worker's time shortened due to usage of bot tasks instead of manual labor. FTE converts hours into the number of people required to complete the same amount of tasks completed by bots.
Alerts
Number of issues appeared in selected Business Process instances.
Monitoring
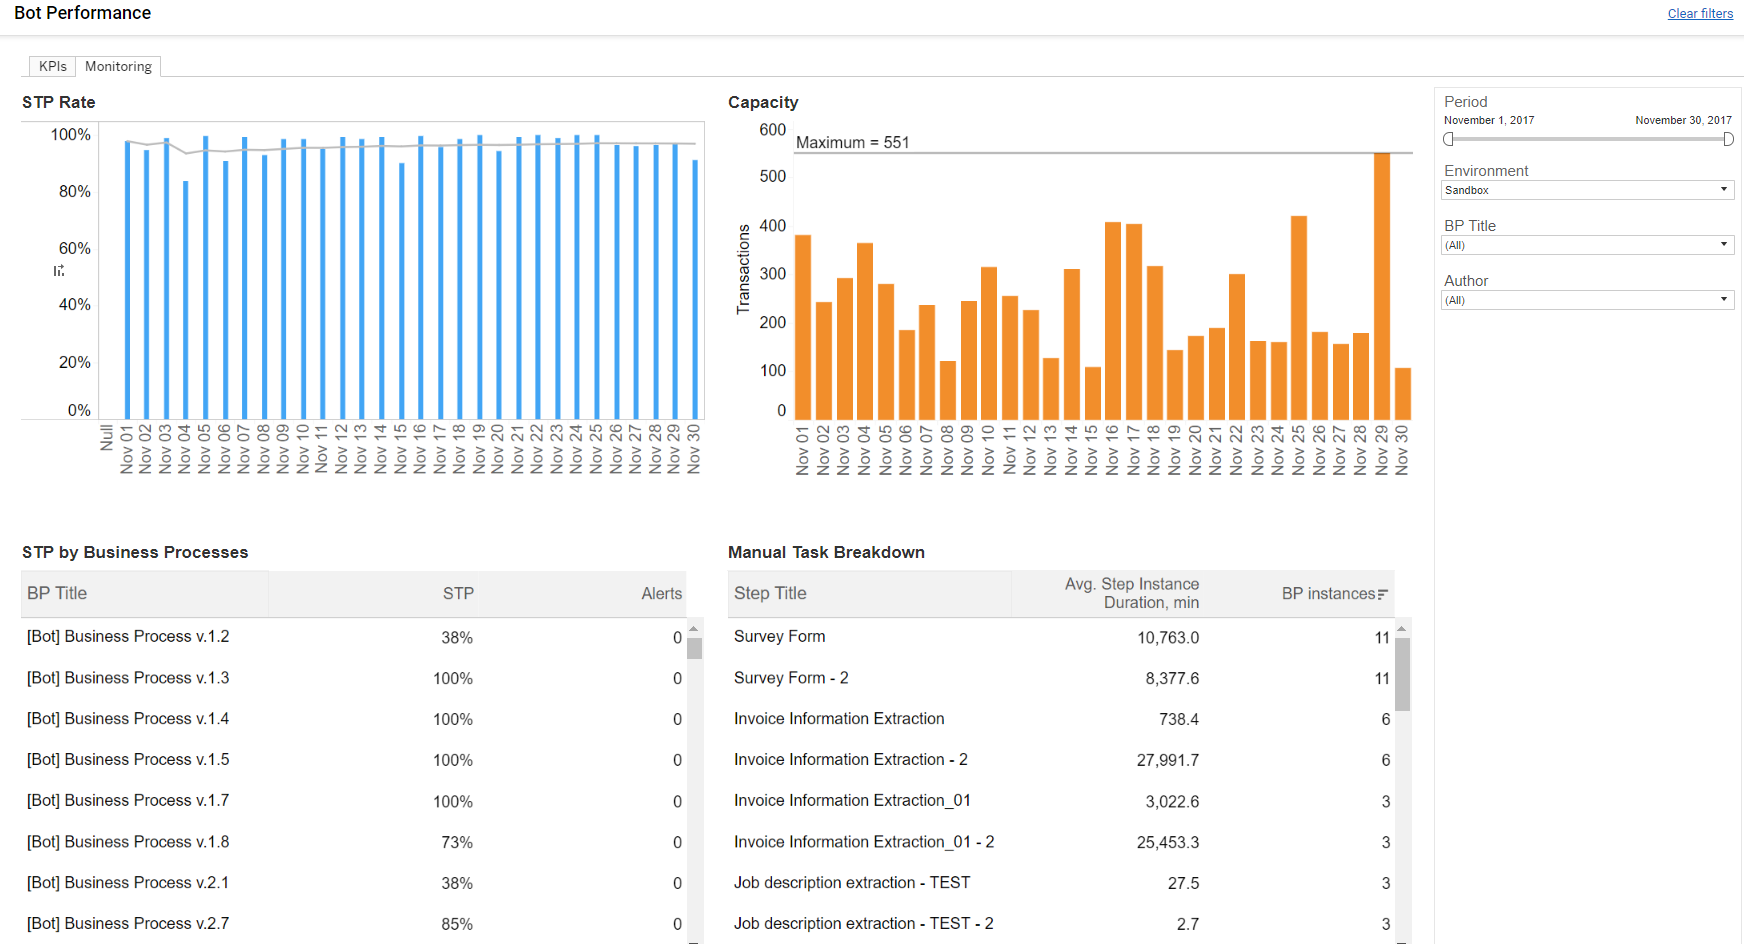
This report displays data about automation and transaction processing capacity.
STP Rate
STP Rate shows ratio of Bot tasks in Business Process(-es) to total amount of tasks (both Bot and Manual).
- Y axis: Date
- X axis: STP Rate, %
Capacity
Capacity widget shows amount of processed transactions within the defined period. This widget can be represented in hours too.
- Y axis: Date
- X axis: Number of Transactions
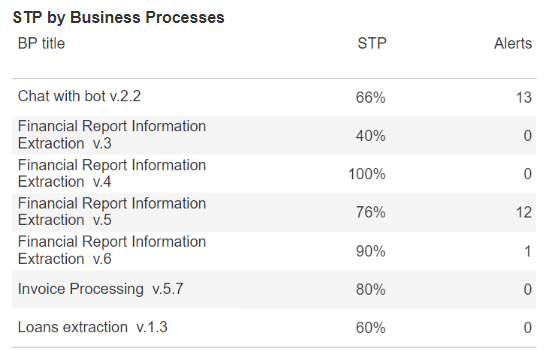
STP by Business Process
This table displays information about STP rate of a specific process together with Alerts identified during the Business Process runs.
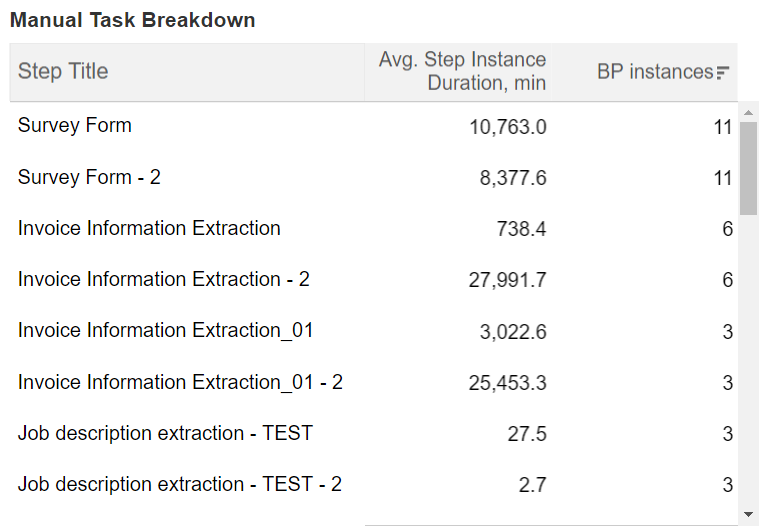
Manual Task Breakdown
This widget shows processing time for Manual tasks. This table helps to identify the tasks, which consumed the largest amount of time and should be considered for future automation.
On the other hand, if you want to increase the STP Rate, you can select a Business Process with a low STP Rate in the "STP by Business Processes" table, then Manual Task Breakdown will be updated respectively, so you can find all the Manual tasks in the selected Business Process, that can be automated.