Cognitive Automation Breakdown
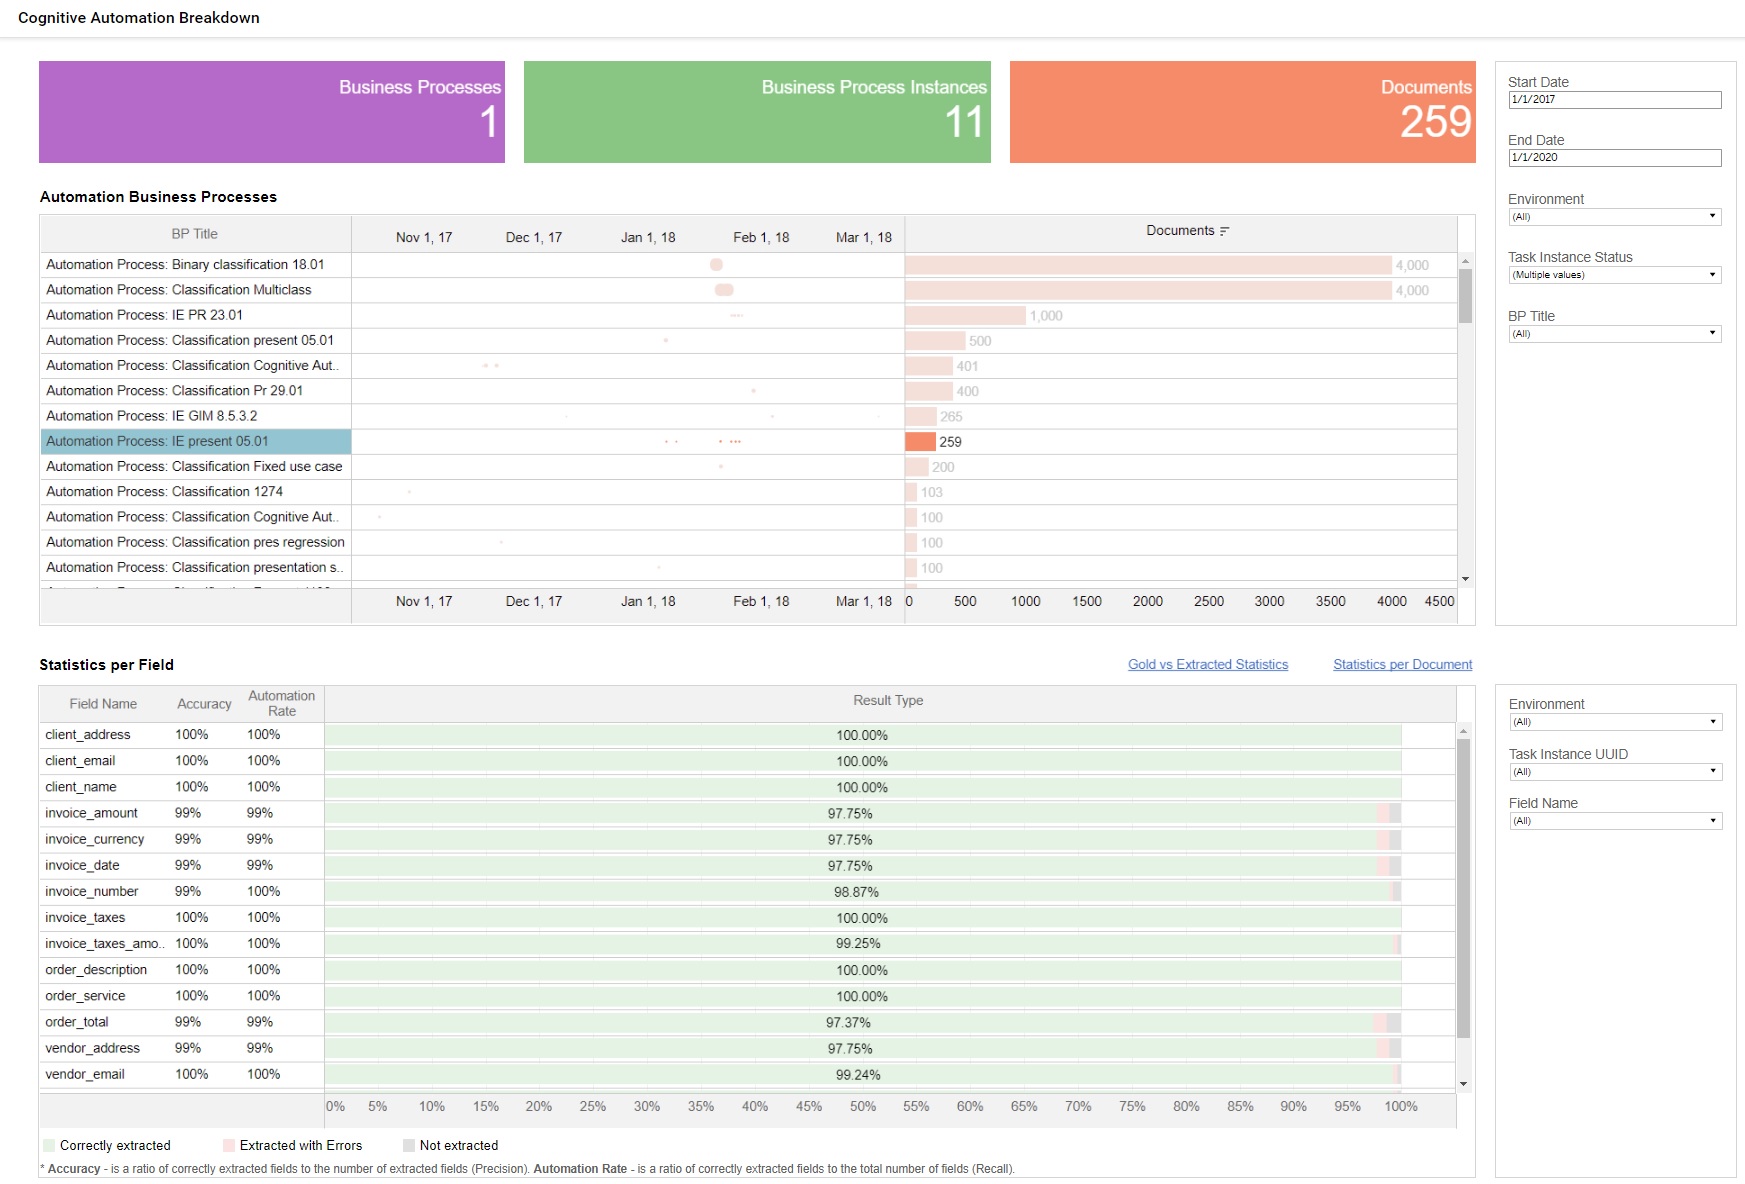
The Cognitive Automation Breakdown report displays detailed information about Statistics for Automation Business Processes. Cognitive Automation Breakdown reports consists of several views: KPIs, Automation Business Processes, Statistics per Document and Field, Gold vs Extracted Statistics. The metrics provide statistics on automation rate and accuracy, that help to analyze performance and quality of ML Models.
Filtering
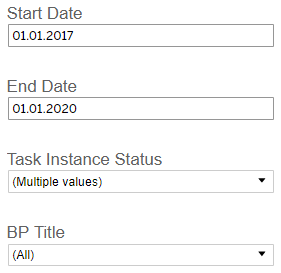
Start Date, End Date: data will be displayed for selected period only. Note: Period is applied to all the widgets within Cognitive Automation Breakdown report.
Task Instance Status: upon selection tiles and Automation Business Process list are updated according to selected statuses. This filter provide possibility to select Statistics Calculation step status.
BP Title: upon selection results displayed for selected items only. All, one or multiple Business Processes can be selected.
Environment: this filter provides a possibility to choose the data for Production, Sandbox or both environments.
Widgets
KPIs
This view displays high-level indicators for Cognitive Automation Breakdown.
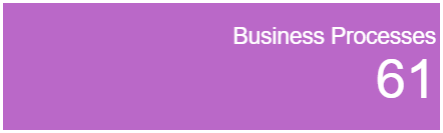
Business Processes: This tile shows the total number of Business Processes created within the selected period. The number of displayed Business Processes can be changed by selecting required Business Processes in the filter. All neighbor tiles also will be updated respectively to display data for the selected Business Processes only.
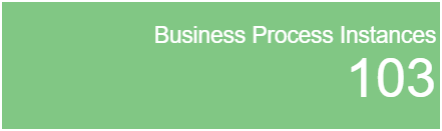
Business Process Instances: This indicator shows a number of Automation Business Process Instances or, in other words, the sum of Business Process runs. Each Business Process can have zero or a few Instances.
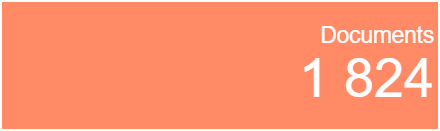
Documents: This tile shows number of Documents processed within displayed Automation Business Processes for selected period.
Automation Business Processes
This widget displays list of Automation Business Processes together with their Instances and cumulative number of Documents being processed per selected period.
In Automation Business Processes list you can see only Automation Business Processes which have Statistics Calculation step and which run at least once with enabled Statistics Calculation step in selected period.
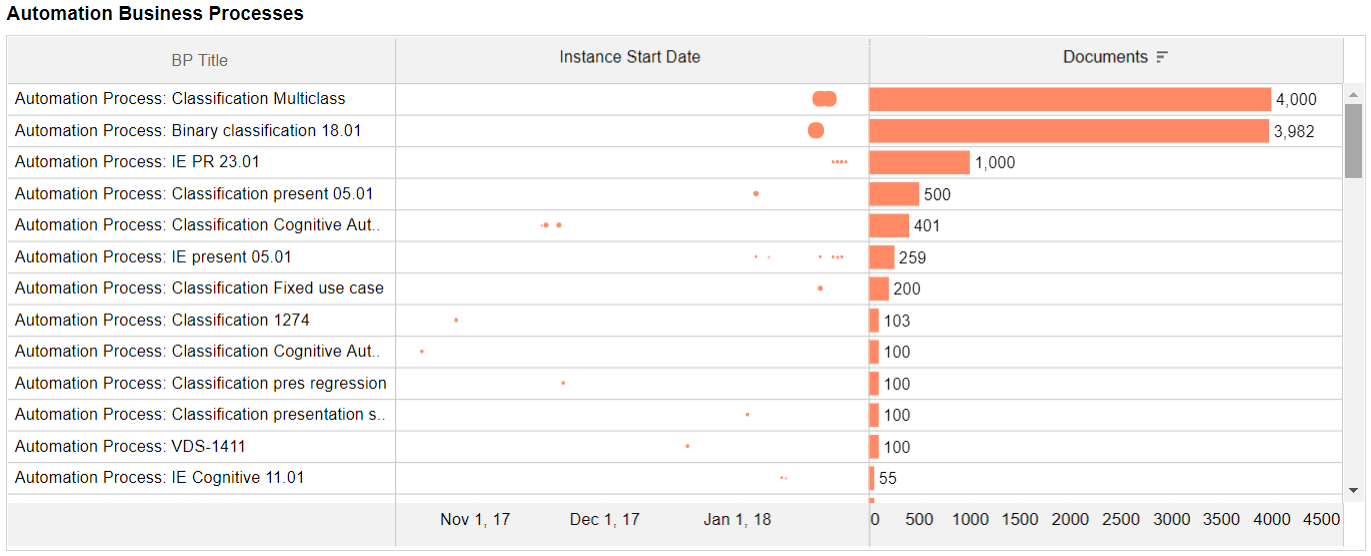
Click a specific BP Title on Automation Business Process so that the Statistics per Field widget appears.

The bottom widget consists of three tabs:
- Statistics per Field
- **Gold vs. Extracted **
- Statistics per Document: Automation Rate and Documents extracted with Errors
Statistics per field
The widget shows Accuracy, Automation Rate and Extraction/ Classification Result type per field. Automation Rate shows the ability of the model to extract all data, while Accuracy shows correctness of extracted data. Result displays proportion of Correctly Extracted fields (TPs and TNs), Extracted with Errors (FPs) and Not extracted (FNs). If consider Automation Rate and Accuracy with respect to Results, then Automation Rate = number of TP per field/ TP+FN; Accuracy = number of TP per field/FP+TP.
By default it displays statistics for all existing instances of selected Business Process. Select specific Task Instance UUID in the filter to view statistics for only one instance.
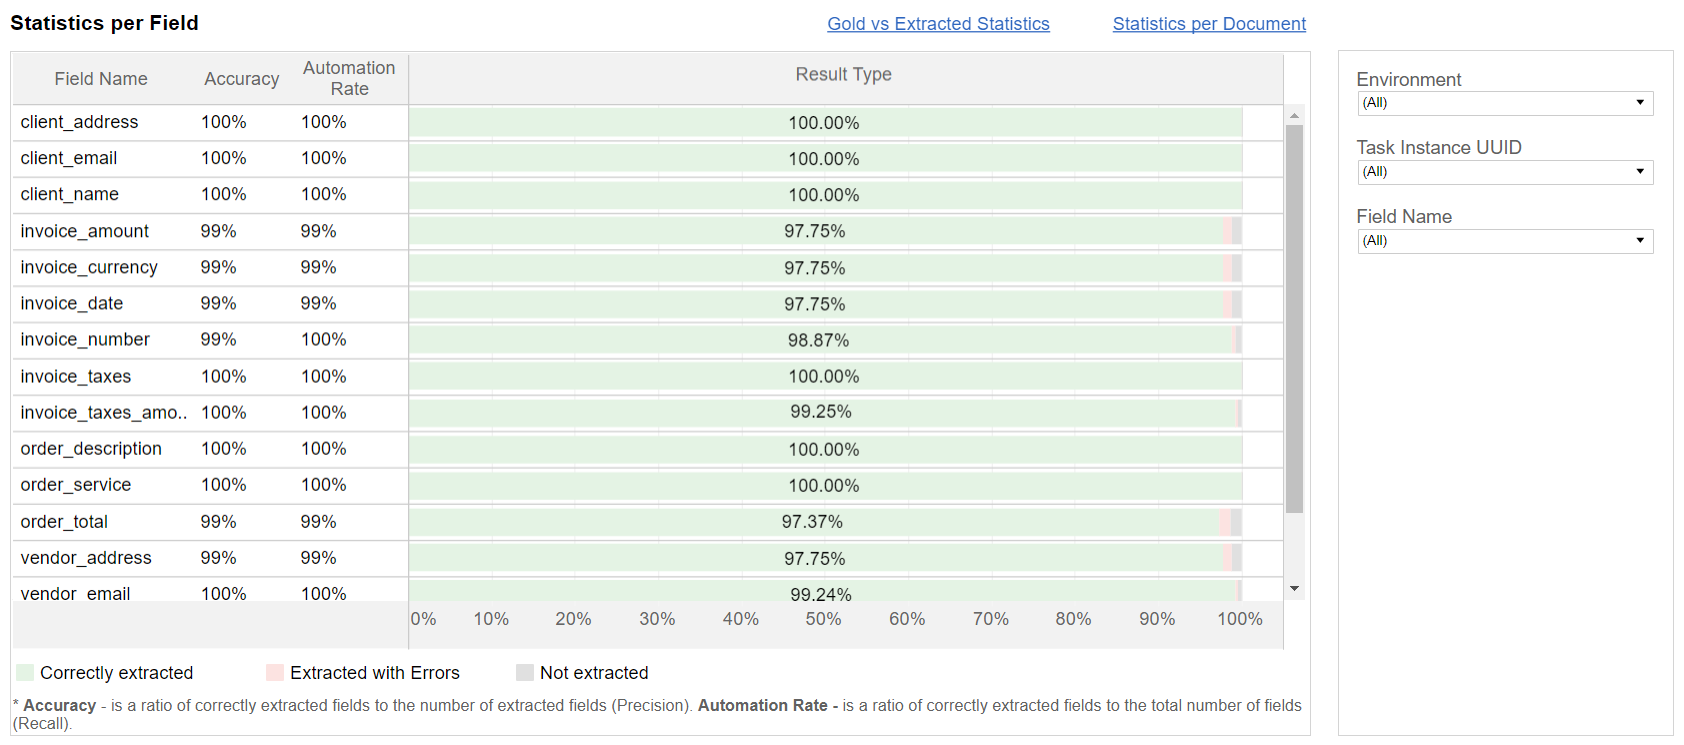
In Statistics per Field, Statistics per Document and Gold/Extracted views you can see data for Business Processes that have enabled Statistics Calculation step and which run at least once with enabled Statistics Calculation step in selected period.
In case Statistics Calculation step is disabled in Automation BP, you still will be able to see data for this Automation BP (BP Title, Instance Start Date and Documents) in Automation Business Processes widget, but you will not find it either in Statistics per Field, Statistics per Document, or in the Gold/Extracted widget.
Gold vs Extracted Statistics
You can get to Gold vs Extracted Statistics widget, once you press on Gold vs Extracted Statistics link on Statistics per Document and Field.
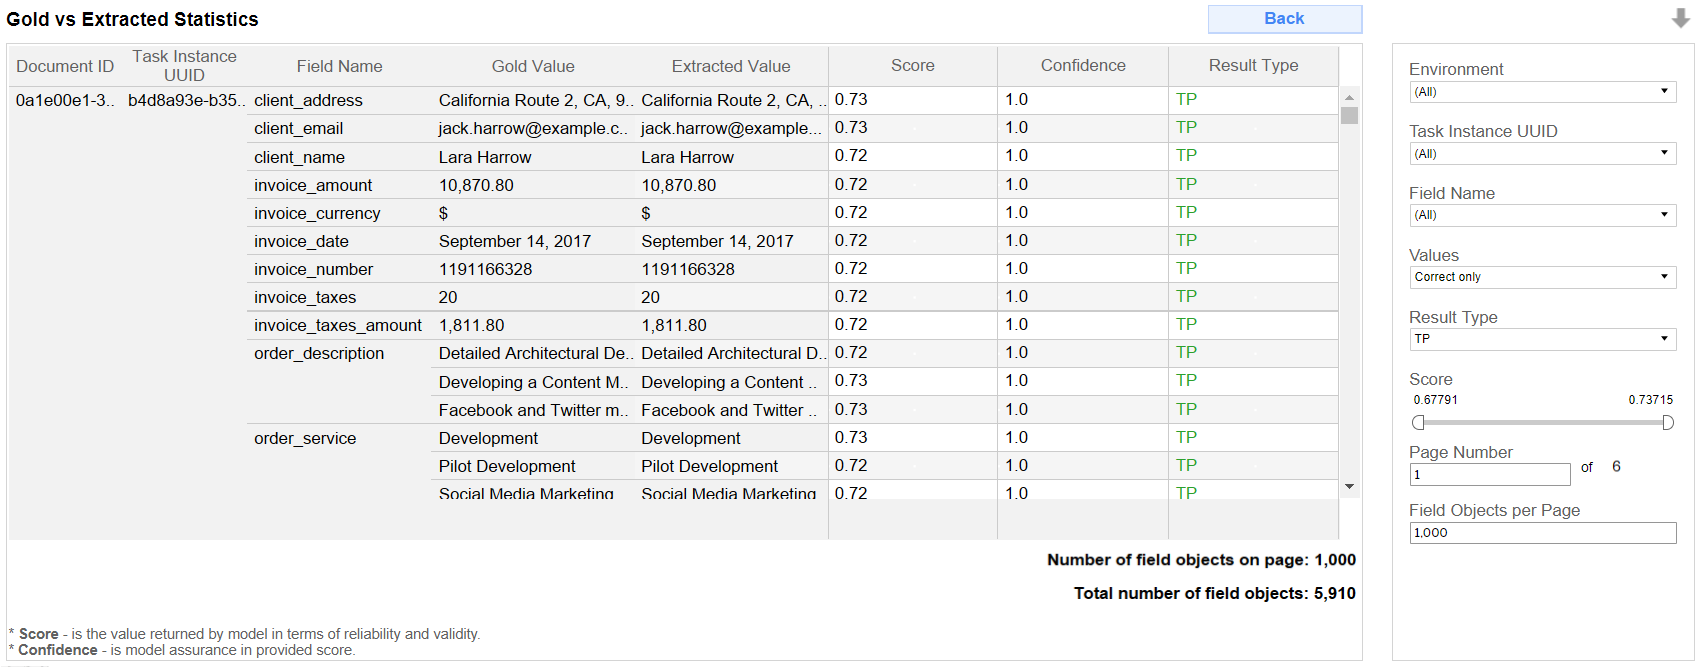
Gold vs Extracted Statistics widget provides detailed information about extraction and classification results. Widget shows the following data:
Gold Value (value tagged by Human)
Extracted Value: value that was extracted by model;
Result Type (TP, FN, TN or FP, FN): result of Gold and Extracted Values comparison
Score and Confidence returned by model
Filtering
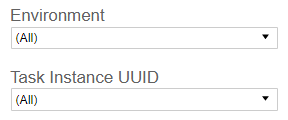
Environment: a possibility to choose the data for Production, Sandbox or both environments.
Task Instance UUID: you can select several or only one Task Instance UUID to view the results.
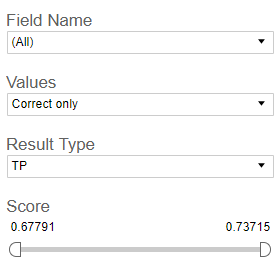
Field Name: a list of fields that were extracted from the documents.
Values: filters widget acoording to the following logic:
- Correct: TP or TN
- Incorrect: FN or FP, FN
- All: both Correct and Incorrect
Result Type: filters widget by Result Type returned after comparison between Gold Value and Extracted Value. Possible values:
- TP
- FN
- FP, FN
- TN
Score: a value returned by model in terms of reliability and validity. Displays minimum and maximum scores returned by model and provides possibility to filter field objects by Score.
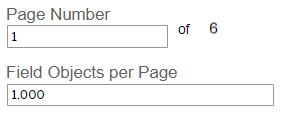
Page Number: a number of pages for this widget and current page number.
Fields Objects per Page: you can adjust number of objects that will be displayed per page.
You can get back to the Statistics per Field widget clicking the Back button.
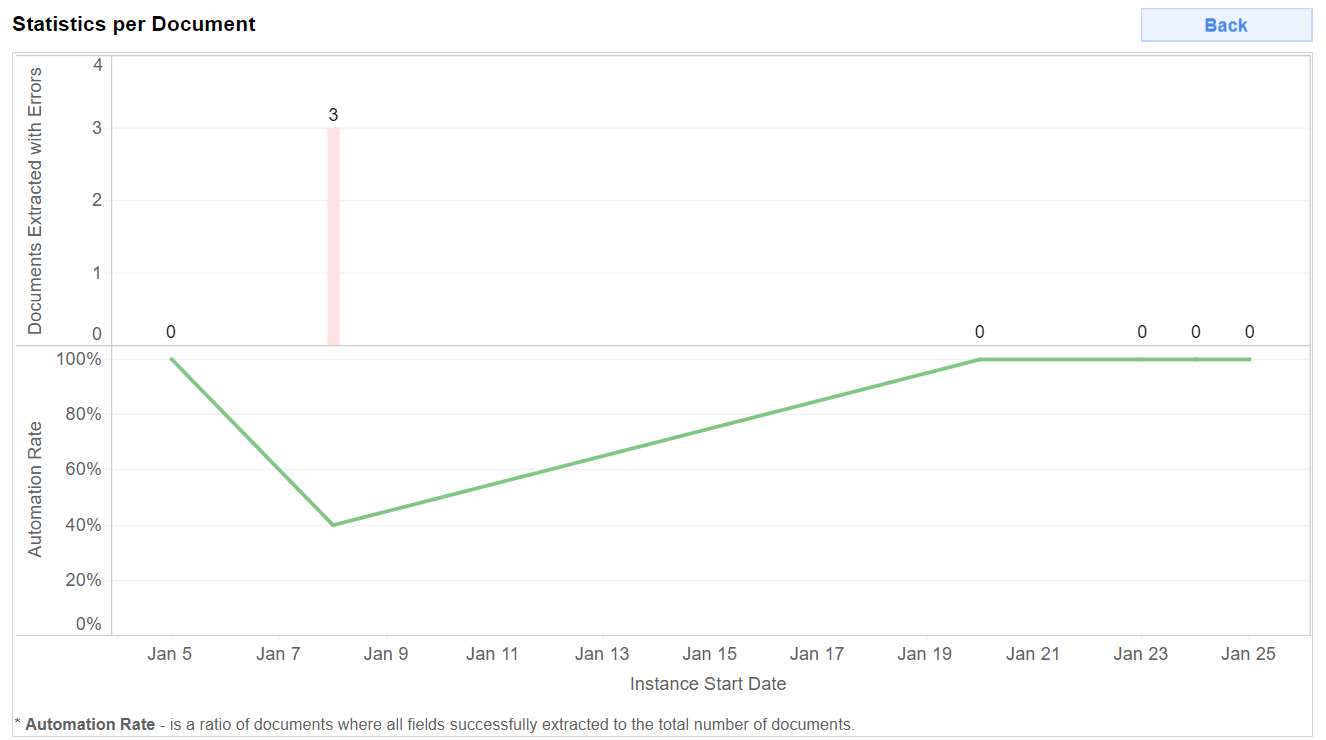
Statistics per Document
This widget consists of two parts: Automation Rate and Documents extracted with Errors.
**Automation Rate **displays a ratio of Number of Documents where all fields extracted correctly by model to Number of all Documents precessed by model and by Human.
**Documents extracted with Errors widget shows how many documents have incorrectly extracted fields. In case at least one field was extracted by model incorrectly, then Document will not be considered within Automation Rate and fall into Documents extracted with Errors. **You can get back to Statistics per Field widget clicking Back button.