Volume and Expenditures
The Volume and Expenditures report displays information about number of submitted Tasks, costs that spent for worker's payment and Adjudication details.
Filtering
The Volume and Expenditure widgets can be performed in daily and monthly view. This helps quickly view data for needed period. For example, compare costs or other metrics during several month.

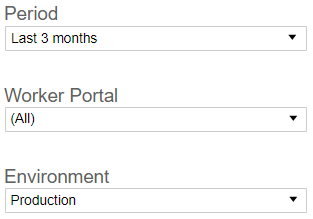
Period: any period can be selected.
Worker Portal: available Worker Portals.
Environment: Production or Sandbox.
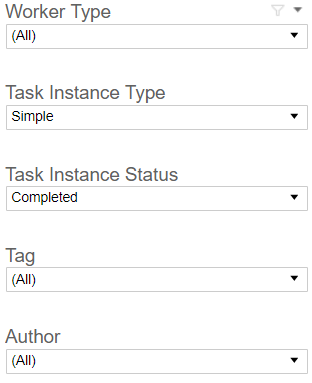
Worker Type:
- Bot
- Human
Task Instance Type:
- Simple
- Qualification
Task Instance Status: upon selection tiles are updated according to the selected statuses:
- Completed
- Paused
- Running
- With Errors
Tag: list of tags added to Business Process by Users.
Author: user who submitted the task.
Widgets
KPIs
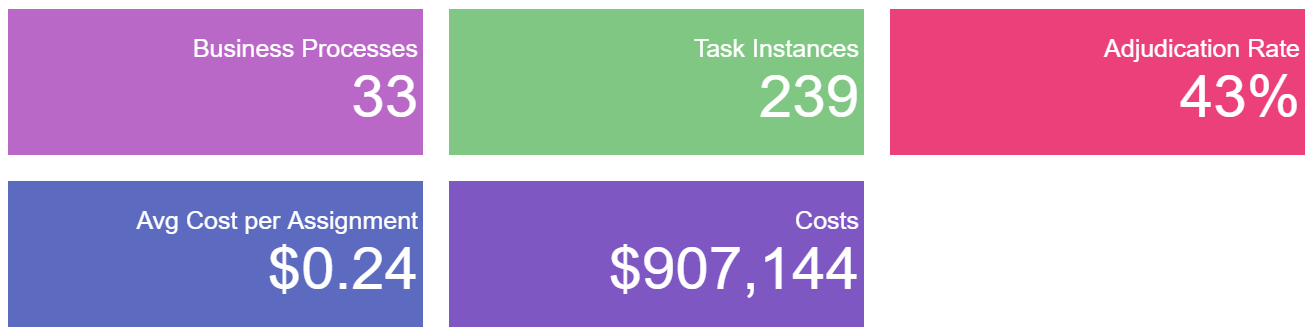
- Business Processes: the tile shows the total number of Business Processes created within the selected period. The number of displayed Business Processes can be changed by selecting some specific Business Processes in filter. All neighbor tiles also will be updated and display data for selected Business Processes only.
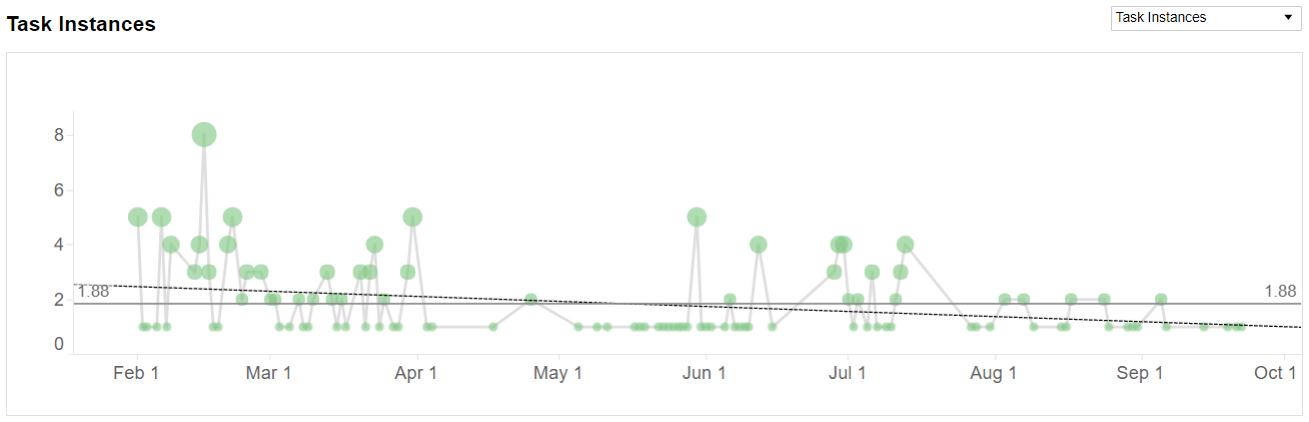
- Task Instances: This value shows number of Task Instances and defines how many times Task run. Each Task can have from zero to many Instances.
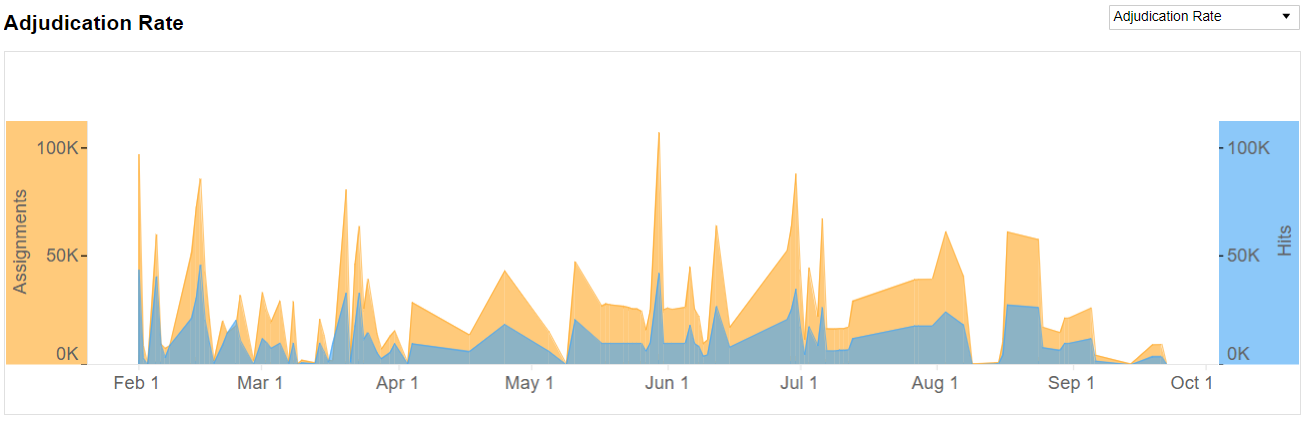
- Adjudication Rate: Ratio of hits to assignments.
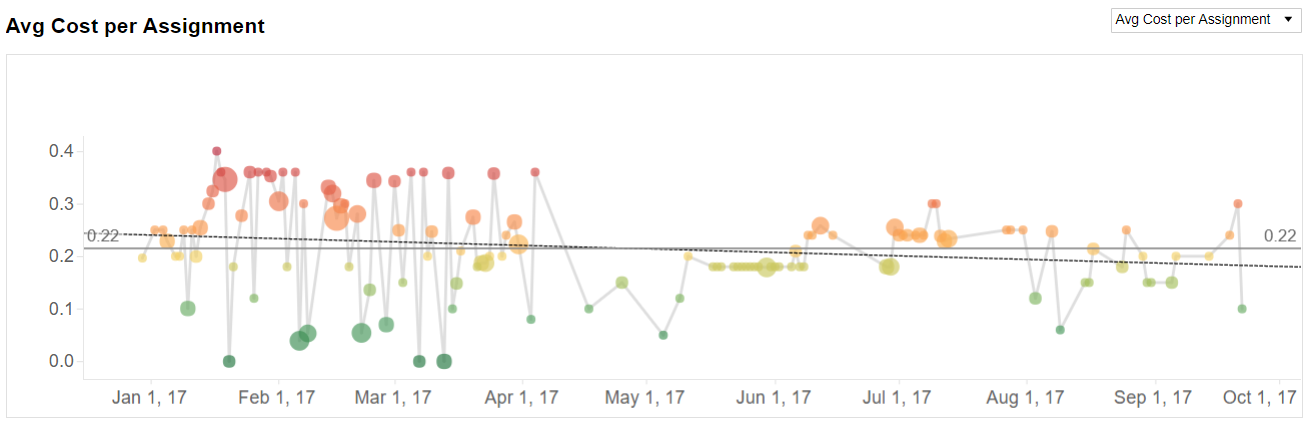
- Avg Cost per Assignment: Average cost of one Assignment.
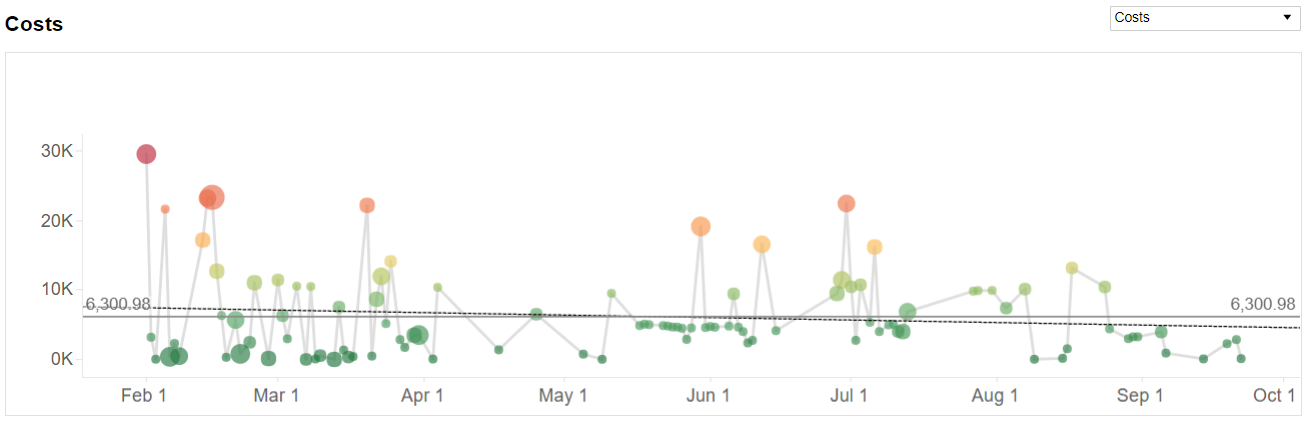
- Costs: Costs spent on worker's salary.
Avg Cost per Assignment
This widget shows the average cost of assignments submitted by workers during selected period.
- Y axis: Avg costs per Assignment, $
- X axis: Date
Task Instances
This widget displays number of task instances that were run in selected period.
- Y axis: Number of Tasks Instances
- X axis: Date
Costs
This widget shows the costs spent on worker's payment in selected period.
- Y axis: Costs, $
- X axis: Date
Adjudication Rate
This widget displays the number of created hits vs. number of assignments in selected period. This values are used to calculate Adjudication Rate, displayed in KPIs.
- Y axis: Assignments (in yellow), Hits (in blue)
- X axis: Date
Business Process Details
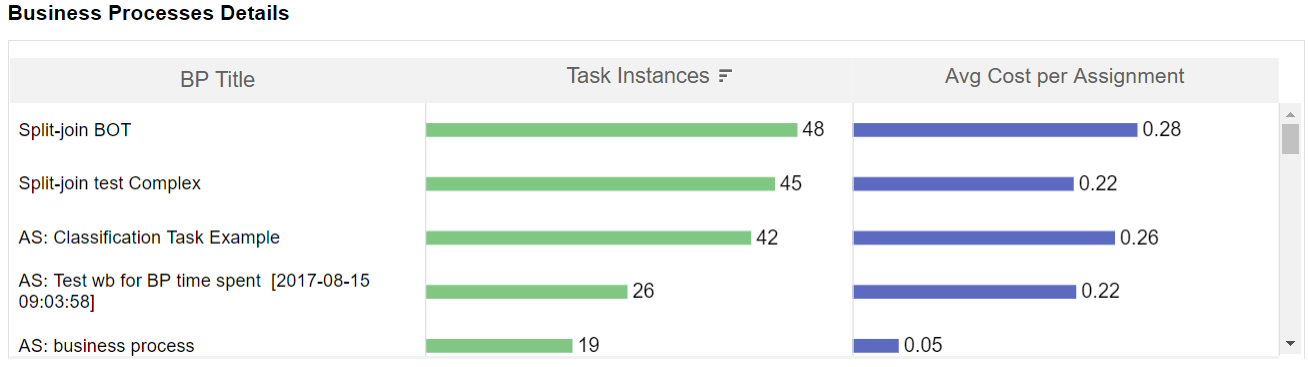
This widget combines data for Business Process, Task Instances and Average Cost per Assignment in one place.
Authors
This widget shows how many task instances each author generated.

Aggregated Data
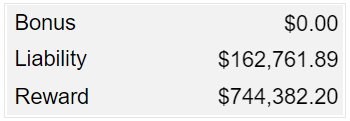
This widget calculates total amounts for several metrics for selected period.
Bonus: how much money spent on Bonuses to Workers.
Reward: payment provided to Workers per all the Assignments.
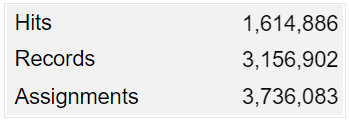
Hits: total amount of hits.
Records: number of Records, processed within all the tasks.
Assignment: number of Assignments, generated by hits.