
Manual Tasks Volume and Average
The widget displays data about amount of tasks processed manually together with average task completion time. This widget helps measure Worker productivity by comparing the amount of completed Tasks with the SLA amount per week (for example, 200 Tasks).
Filtering
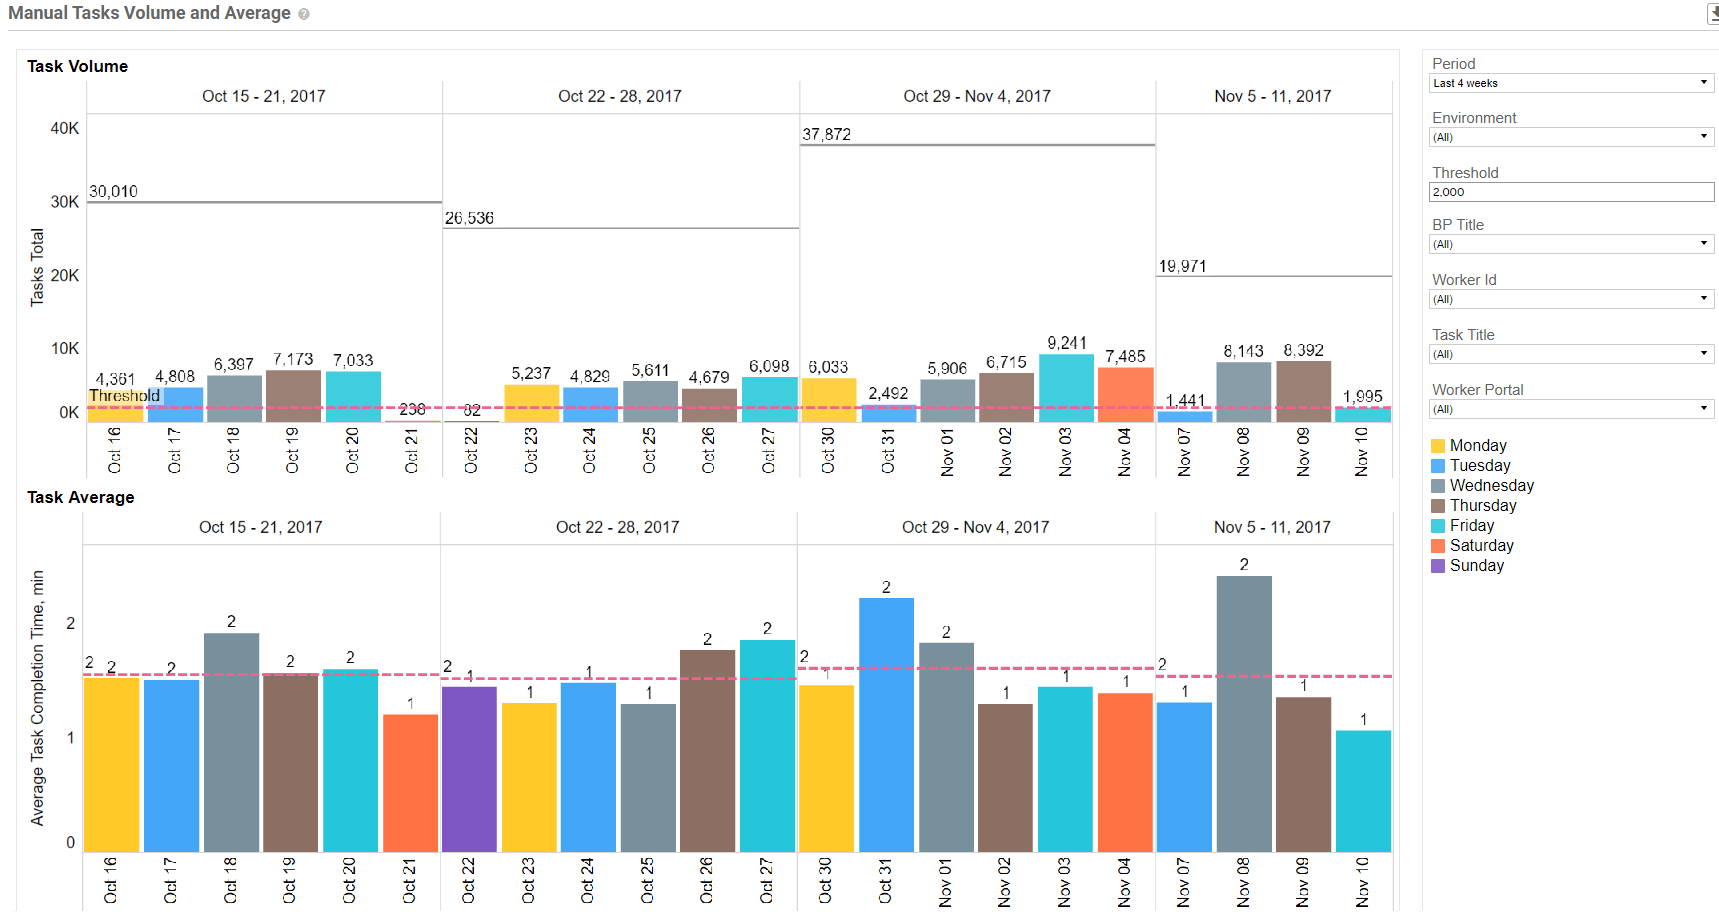
Period: allows to select specific period.
Environment: Production or Sandbox.
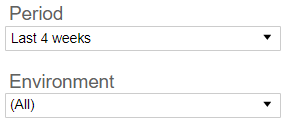
Threshold: specifies when workers completed some specific number of tasks.

Business Process title: upon selection all widgets will display results for selected items only. All, one or multiple Business processes can be selected.
Worker ID: a list of available workers.
Task Title: a list of processed task names.
Worker Portal: a list of available Worker Portals.
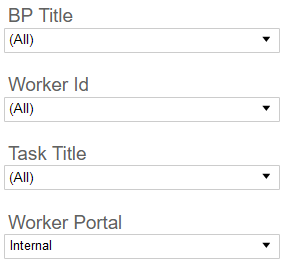
Colors on widgets show specific day of the week, that is why they are the same in each week.
Widgets
Task Volume
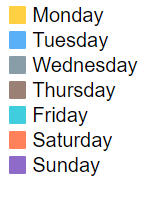
This widget displays a number of tasks completed by workers for a selected period, with total amount of tasks per week.
- Y axis: Task Total.
- X axis: Timeline.
In the example above, The SLA amount is 2000 Tasks per week. The first week total result is 30,010 Tasks (blue horizontal line) – this is more than SLA (2000) and the analyst shouldn't take any actions. But in SLA amount is not met, then the analyst should take some actions:
- Add more Workers or Crowds.
- Notify all Workers about new Tasks available.
- Qualify and teach existing Workers to improve their performance, and so on.
Tasks Average
This widget displays average task completion time for selected Workers. If the average Task Completion Time becomes very high, the analyst should probably look for qualified Workers or split complex Tasks into several mid-level ones.
- Y axis: Average Task Completion Time, min.
- X axis: Timeline