
Elastic monitoring
The monitoring solution contains the following components:
- Kibana with system performance dashboards
- Elasticsearch for storing metrics data
note
There is no Authentication method enabled for Kibana dashboards.
Monitoring
Monitoring dashboards are available in Kibana UI.
You can find UI by visiting https://apm.example.com/kibana location.
Under the Dashboard tab, you see all preconfigured dashboards.
Dashboards
[Metricbeat System] Overview
This dashboard contains brief summary regarding all configured hosts:
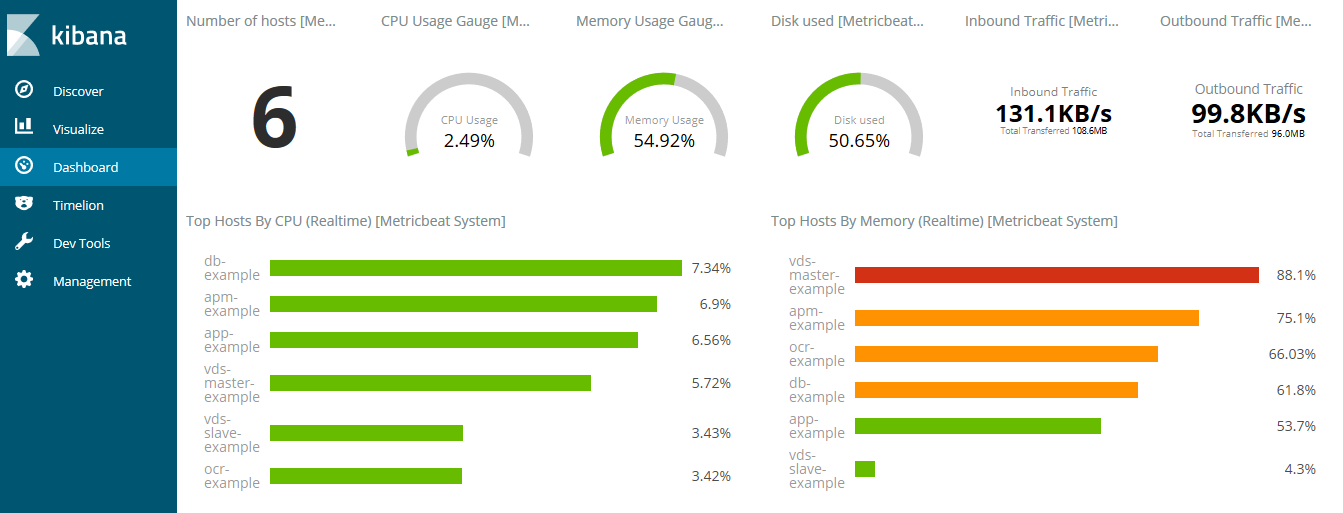
By clicking on desired host, the Host overview dashboard page will open which contains detailed information regarding respective instance.
[Metricbeat System] Host overview / [Metricbeat Windows] Services
This dashboard contains detailed time-series information per the host:
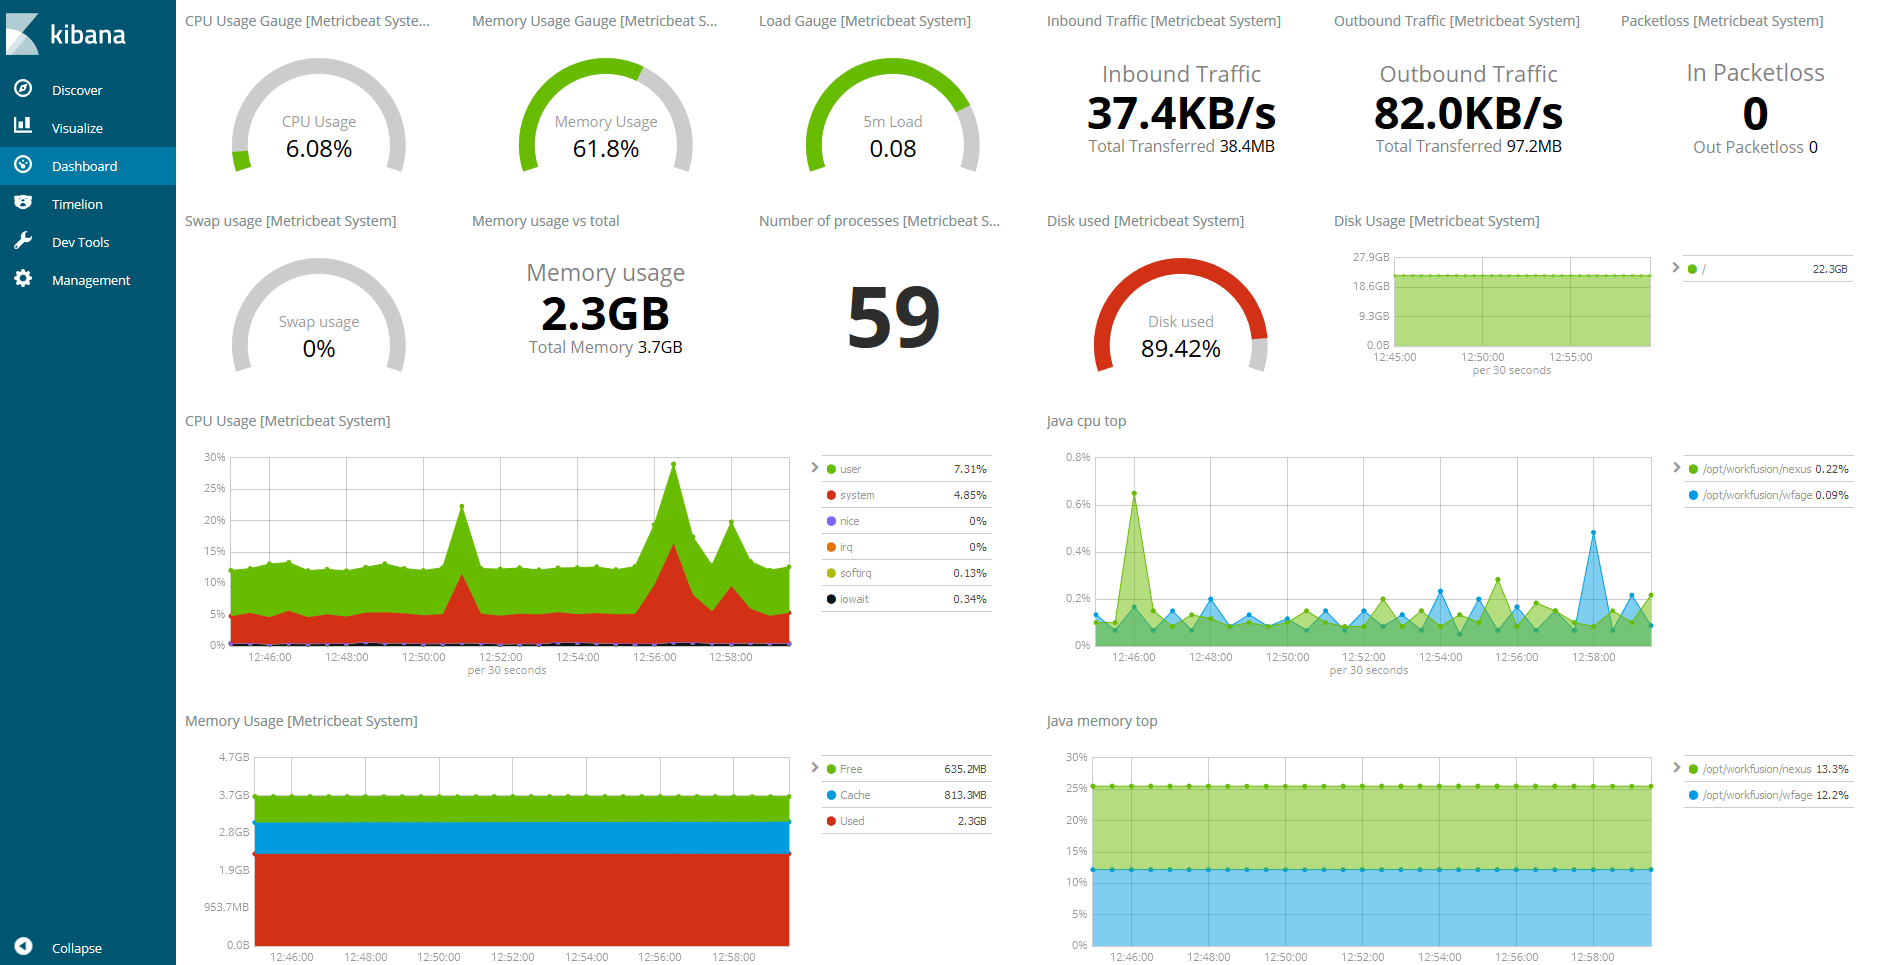
The current release provides information regarding Linux hosts only.