
Overview
The Overview dashboard is a starting point of the powerful analytics of your automation journey enabling high level view your business processing state within SPA. It aggregates the data about the business processes transactions volume, bot utilization, issues during processes executing, SLA violations volume and percentage. All this is a high-level information allowing to drill down to a particular process execution details when required.
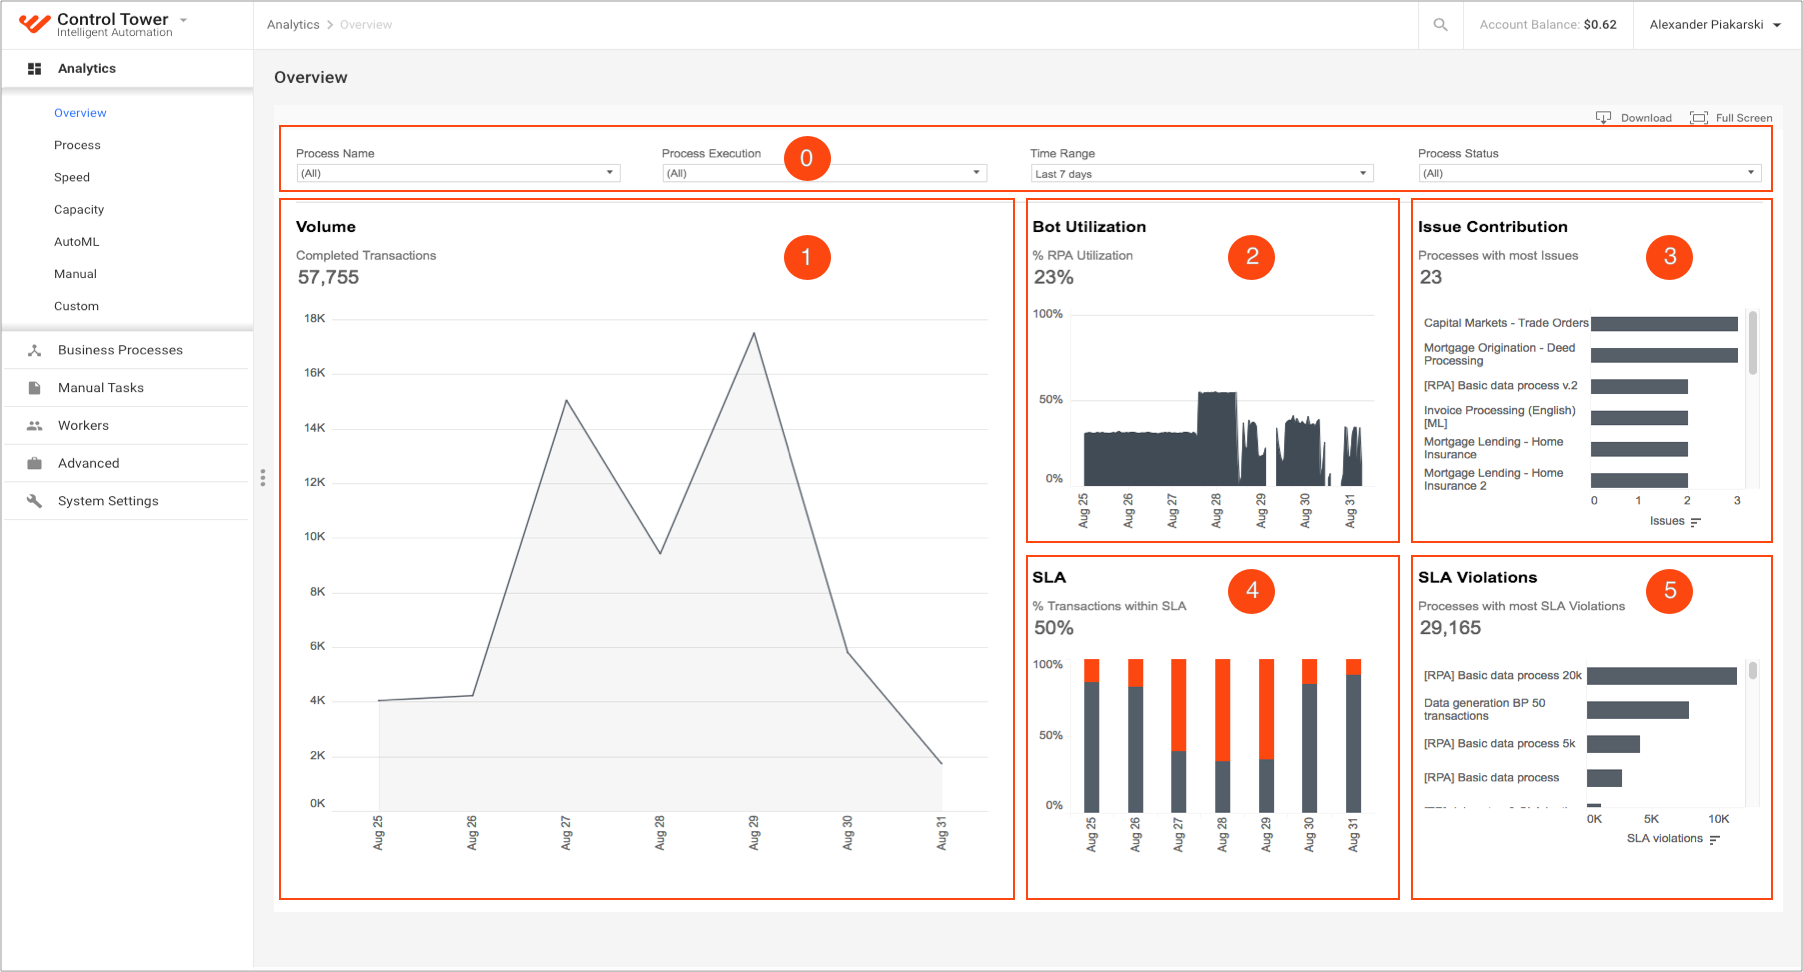
1 - Volume 2 - Bot Utilizations 3 - Issue Contribution 4 - SLA 5 - SLA Violations
A tooltip is displayed on mouse hover over an element (point or bar). It contains additional information about a specific element.
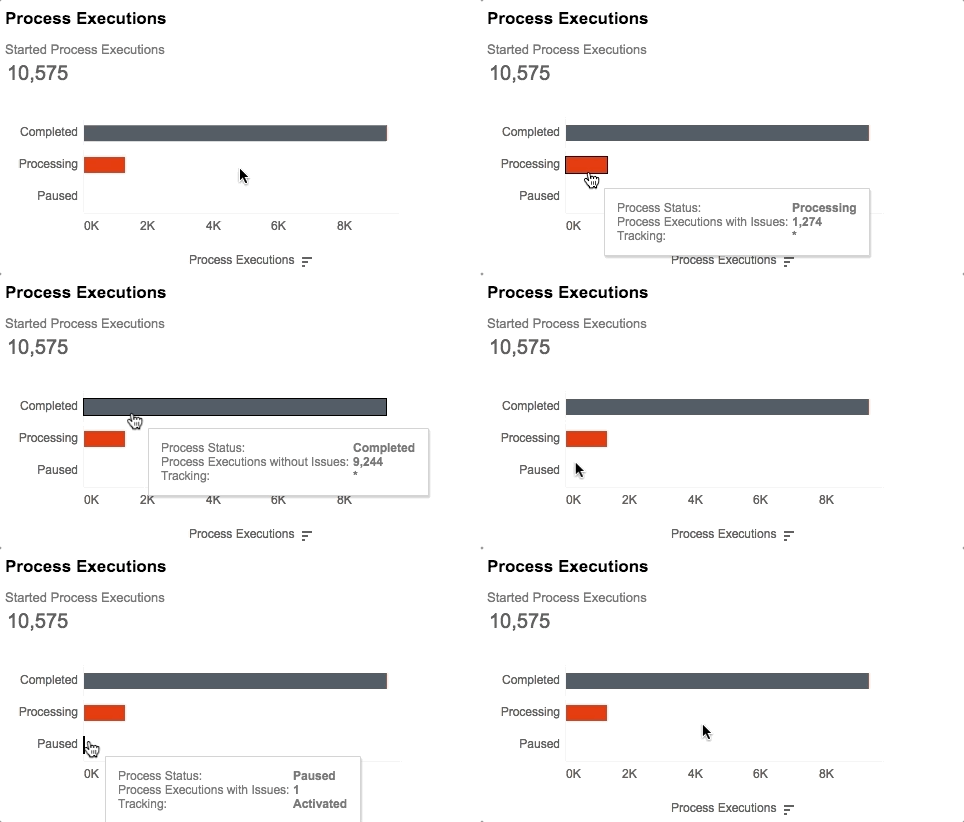
The Tracking field in a tooltip means Transaction Tracking. There are three values:
- Activated: For all Process executions transaction on this day transaction tracking is enabled. Transactions count by documents.
- Not Activated: Transaction tracking NOT enabled for all process executions on this day. Transactions count by input records automatically.
- *: multiple values. Only in some process executions transaction tracking is enabled.
In the others fields, also If there is more than one possible value, it returns the (*) in the tooltip, for example, SLA values.
Filters
Select the data that will be displayed on the dashboard. Users can interact with filters the following way:
Make a different selection in the checkboxes.
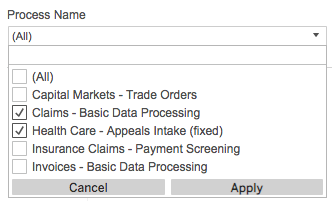
Uncheck the All checkbox and start typing, for example, a process name:
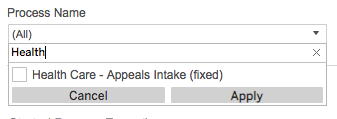
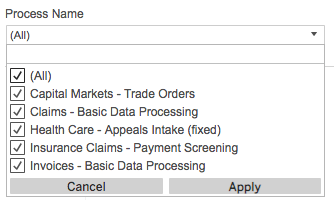
Process name
Filter values by name of process. Default value: check all processes.
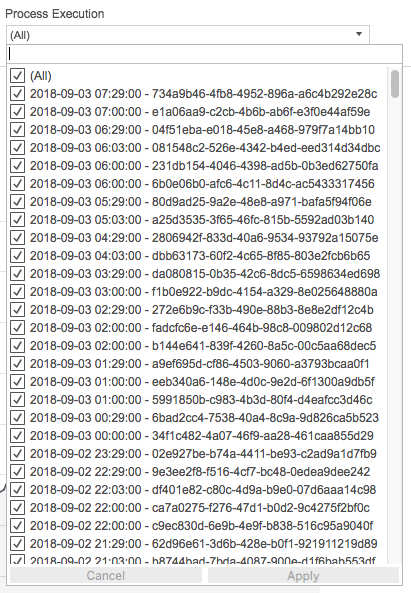
Process Execution
Allows to choose specific process execution. The row in a filter is combined by two values:
- Process Execution Start Date
- UUID of Process Execution
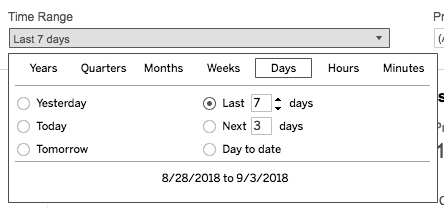
Time range
Users can filter time range (Process Execution Start Date). Default value: 7 last days. Dashboards have data for last 30 days.
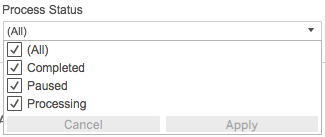
Process Status
There are three types of process status:
- Completed
- Processing
- Paused
Volume
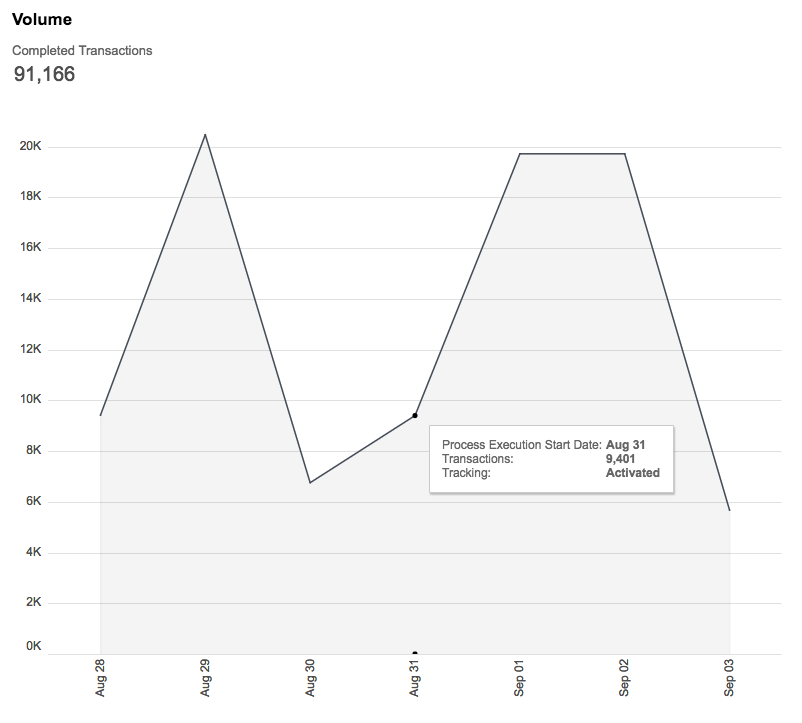
Chart visualizes the value of completed transactions over time on a daily basis.
- X-axis: Date (Process Execution Start Date).
- Y-axis: Number of transactions. Only completed transactions count.
Tooltip has the following information:
- Process Execution Start Date
- Number of competed transactions, started on this day
- Transaction tracking.
Bot Utilizations
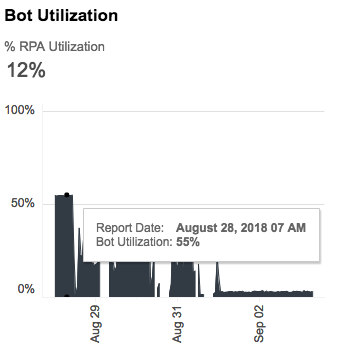
The chart shows workload on an hourly basis.
- X-axis: Date (Process Execution Start Date)
- Y-axis: Workload
Tooltip has the following information:
- Date and hour
- Workload (percentage of average active time for all bots and bot relays in the specific hour)
Issue contribution
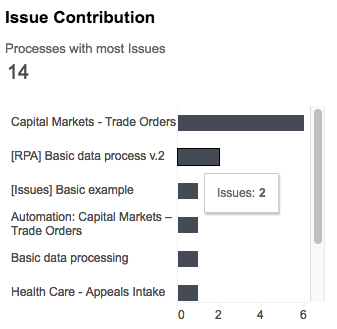
The chart shows only processes with issues.
- X-axis: number of issues
- Y-axis: list of processes in descending order
Tooltip has the information about the number of issues.
SLA
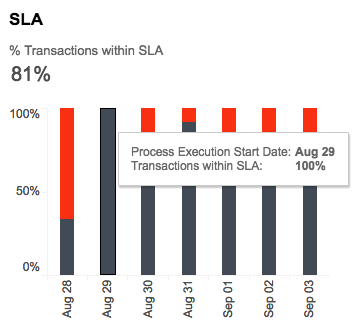
The chart shows percentage of transactions within SLA and SLA violations to all completed transactions started on this day.
- Grey: transactions within SLA (met SLA)
- Red: SLA violations (missed SLA)
SLA (Service Level Agreement) is used to define whether transactions processing meets business expectations. SLA available only if transaction tracking is enabled, else all transactions considered to meet SLA by default.
There are two SLA types:
Cycle time of a transaction must be lower than X seconds. If a transaction cycle time is less than or equal to SLA value than a transaction meets SLA, else - missed.
Volume of transactions must be higher than X transactions per day. If volume of transactions for a day is greater than or equal to SLA value, then all transactions meet SLA, else all of transactions below SLA value are marked as missed SLA.
X-axis: Date (Process Execution Start Date)
Y-axis: Percentage of transactions within SLA
When a user hovers over a mark, the tooltip displays the relevant data.
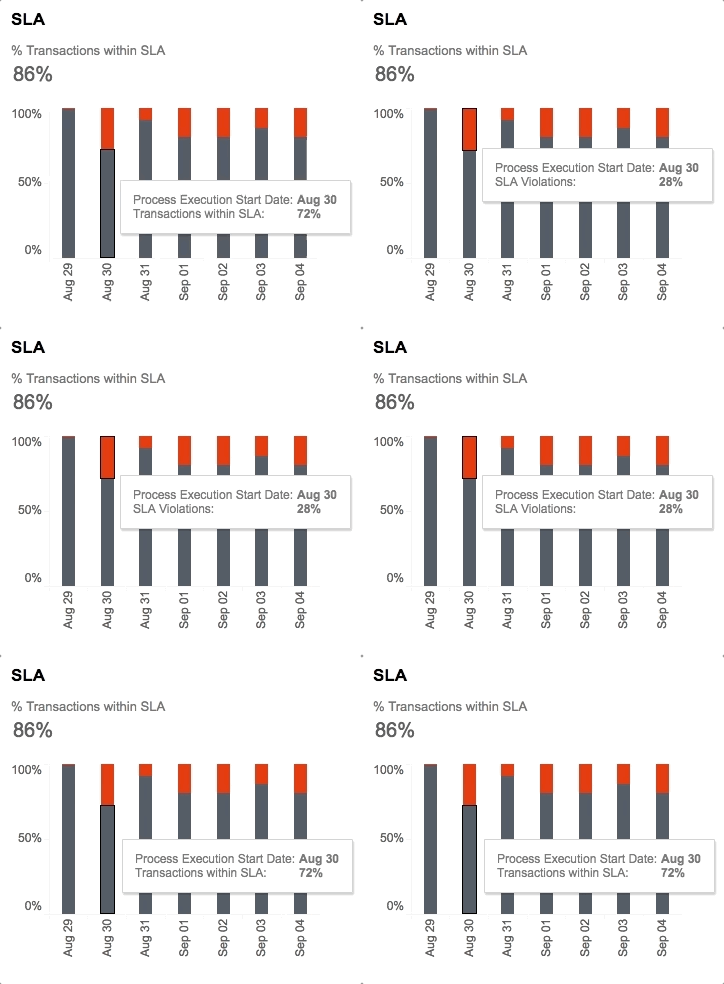
- Date
- Percentage of: SLA violations OR transactions within SLA
SLA violations
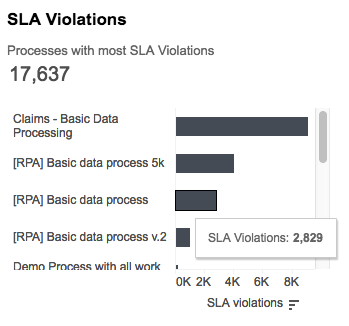
The chart shows only processes with SLA violations (number of transactions, which missed SLA).
- X-axis: number of SLA violations
- Y-axis: list of processes in the descending order
Tooltip has the information about the number of SLA violations.