RPA estimates
note
For more details, refer to:
Introduction
This article gives overall description of RPA and describes different approaches on how to estimates RPA use-cases based on provided input and situations. Target audience is Solutions Consultants and Solutions Architects.
RPA Basics
note
Robotic process automation (or RPA or RPAI) is an emerging form of business process automation technology based on the notion of software robots or artificial intelligence (AI) workers.
In traditional workflow automation tools, a software developer produces a list of actions to automate a task and interface to the back-end system using internal application programming interfaces (APIs) or dedicated scripting language. In contrast, RPA systems develop the action list by watching the user perform that task in the application's graphical user interface (GUI), and then perform the automation by repeating those tasks directly in the GUI. This can lower the barrier to use of automation in products that might not otherwise feature APIs for this purpose.
RPA tools have strong technical similarities to graphical user interface testing tools. These tools also automate interactions with the GUI, and often do so by repeating a set of demonstration actions performed by a user. RPA tools differ from such systems including features that allow data to be handled in and between multiple applications, for instance, receiving email containing an invoice, extracting the data, and then typing that into a bookkeeping system. The data manipulation aspect is
not something one would normally find in a testing tool.
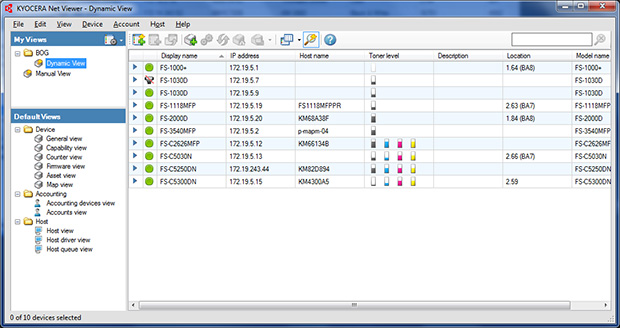
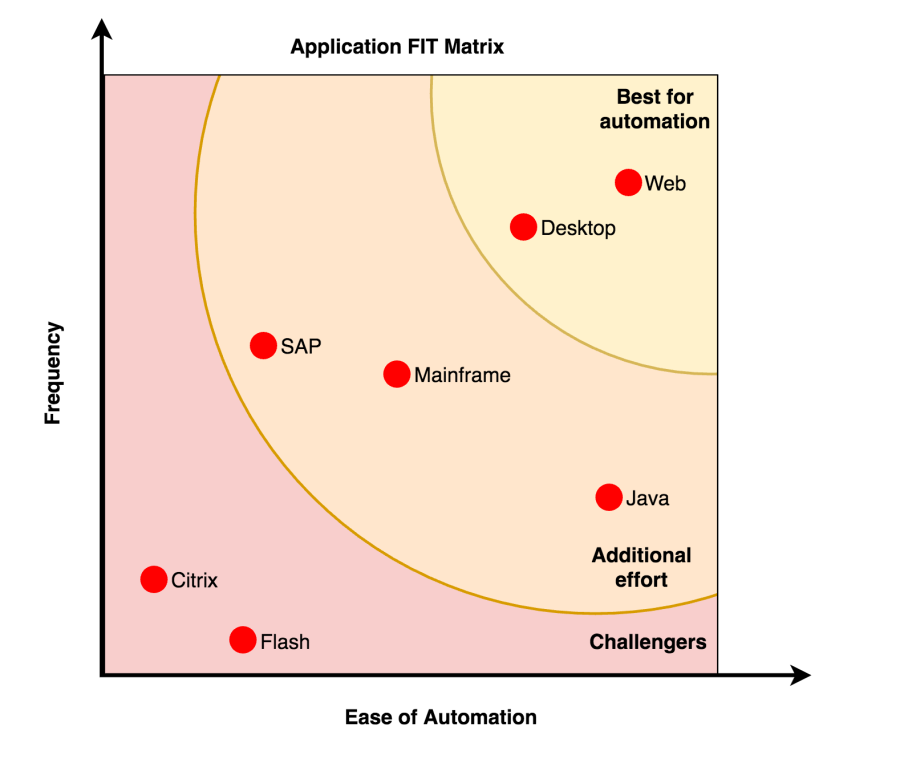
RPA is targeted at desktop applications, which can be classified in several ways. At WorkFusion we have following categories with few screenshots to give better understanding
Web accessed from browser
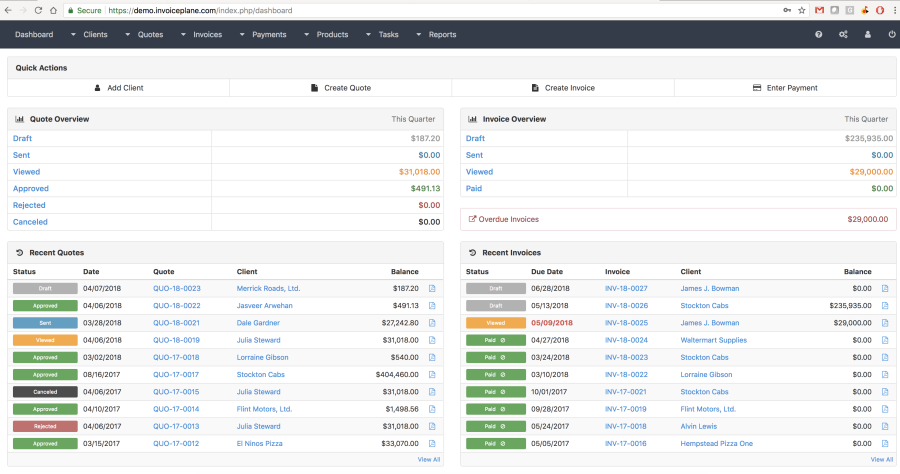
Desktop usually .exe files with GUI (MS Excel)
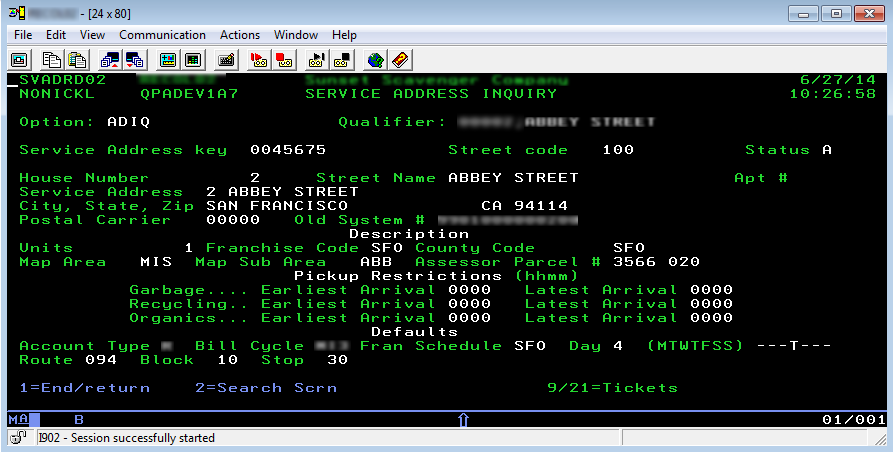
Mainframe is subclass of Desktop. Usually looks like console with green letters (IBM AS/400)
SAP is subclass of Desktop. Due to its broad distribution and nuances in automation, SAP was moved as separate category
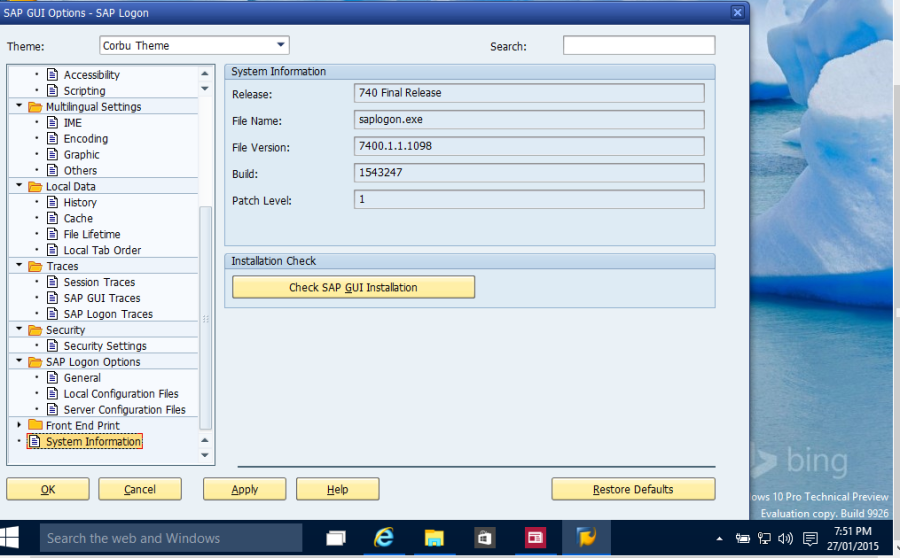
Java is subclass of Desktop which is built in Java language
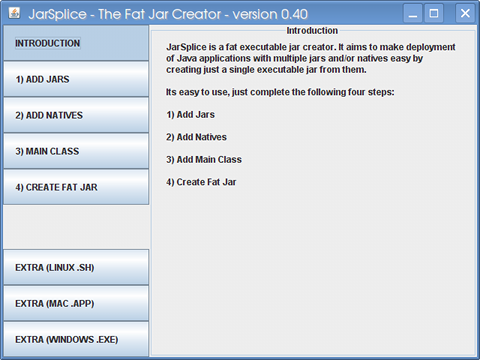
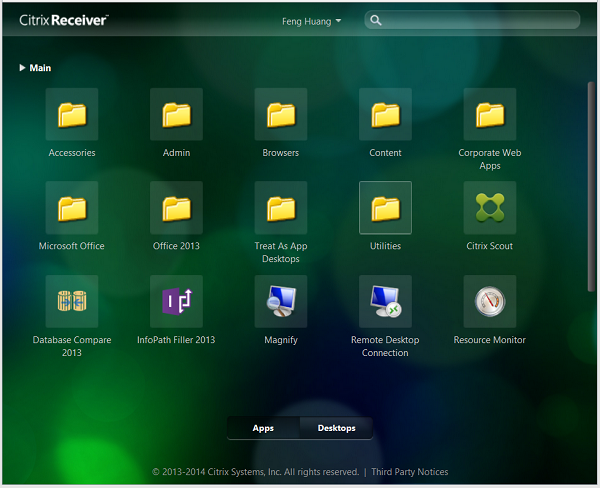
Citrix/Flash these two different types of applications are grouped into one category due to automation limitations. Only surface based (image based) approach is applicable
Application FIT matrix below shows which types of applications are easier to automate and how often one usually appears in real life.
Types Of Estimates
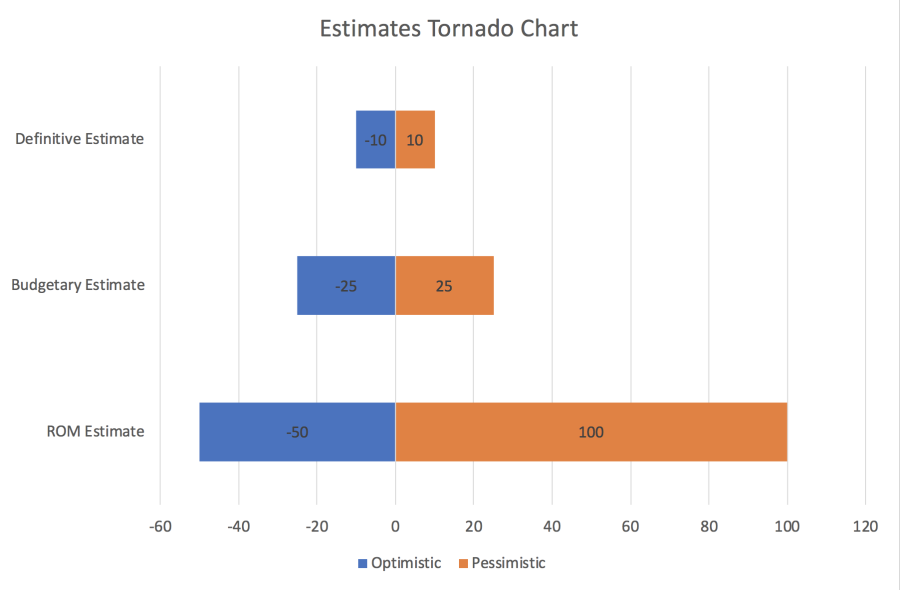
There are 3 types of estimates with corresponding accuracy and time spent per each, table below gives brief overview of each with some other details:
| Estimate Type | When to Apply | What is required | How Accurate |
|---|---|---|---|
| Rough Order of Magnitude (ROM) Estimate | This estimate gives a "ballpark" for the project. In other words, this high level estimate lets you know whether the project is going to take $50,000 or $5,000,000. Whether it will take six weeks, six months, or six years. Could be used for RFx. This estimate is used very rarely when there are almost no description of use-case | Number and types of applications | -50% to +100% |
| Budgetary Estimate | Most commonly used type of estimate based on provided information discovery phase. Usually enough to be put into SOW. Tradeoff between detailed description and accuracy | Description of application flow: Can be provided within:
| -25% to 25% |
| Definitive Estimate | Gives the most precise numbers, but usually requires a lot of work to put upfront to collect full requirements. System integrators companies usually use that. Useful during enterprise program development, when same application can be used in different business processes | Well documented process requirements describing every step robot should perform. | -10% to 10% |
Chart below shows the accuracy ballparks for 3 types of approaches.
Rough Order of Magnitude (ROM)
Refer to the table below to get a rough estimate for how much development time will be needed. Complexity can be estimated based on effort that worker spends on application:
- Simple: Up to 5 min
- Medium: 5-10 min
- Complex: 10 min and more
| Application | Small | Medium | Large |
|---|---|---|---|
| Web | 1 weeks | 2 weeks | 3 weeks |
| Desktop | 2 weeks | 2 weeks | 4 weeks |
| Mainframe | 2 weeks | 3 weeks | 4 weeks |
| SAP | 2 weeks | 3 weeks | 4 weeks |
| Java | 2 weeks | 3 weeks | 4 weeks |
| Citrix/Flash | 3 weeks | 4 weeks | 6 weeks |
Budgetary Estimate
During the development phase engineers put different efforts depending on the application type even if robot flow is similar. Table below illustrates complexity comparison across application types. Web application type as easiest one is a taken as baseline, when other types are described as how more complicated it is compared to Web.
| Application | Complexity |
|---|---|
| Web | 1. |
| Desktop | 1.1. |
| Mainframe | 1. |
| SAP | 1. |
| Java | 1. |
| Citrix/Flash | 1. |
Total estimate also depends on number of actions that robot needs to perform, and can be calculated as number of pages multiplied by average number of actions per screen. For example, If there are 3 screens in total having 4, 10 and 13 actions correspondingly, then total number of actions is 3*9 = 27.
Let's say developer needs 20 mins for every action, so for web application with 27 actions effort is 27 * 20 / 60 = 9 hours. If it is Mainframe application, then corresponding coefficient is applied, so it is 18 hours in total.
There are some other factors that need to considered: application complexity and use-case stage (POC/Production).
There are 3 levels of complexity and table below describes how to determine which one it is including effort coefficients.
| Complexity | Indicators | Coefficient |
|---|---|---|
| Easy |
|
1x |
| Mid-Complex |
|
2x |
| Complex |
|
3x |
Usually there are different requirements for POC and Production Pilots or Production roll outs. POC usually allows it be fast and dirty, skipping certain business flows. While production requires code to be polished, all cases needs to be considered and etc. The effort difference can be from 2x to 3x depending on use-case complexity and some other factors like security restrictions, validations, application stability and etc
At the end, application estimate formula looks like:
T - Total number of actions (clicks, get/set value, navigation, etc)
A - Application Type (web, desktop, etc)
C - Application Complexity (simple, medium, complex)
S - POC or Production
P - Productivity (number of actions per hour – usually 3-4)
Total in hours = T * A * C * S / P
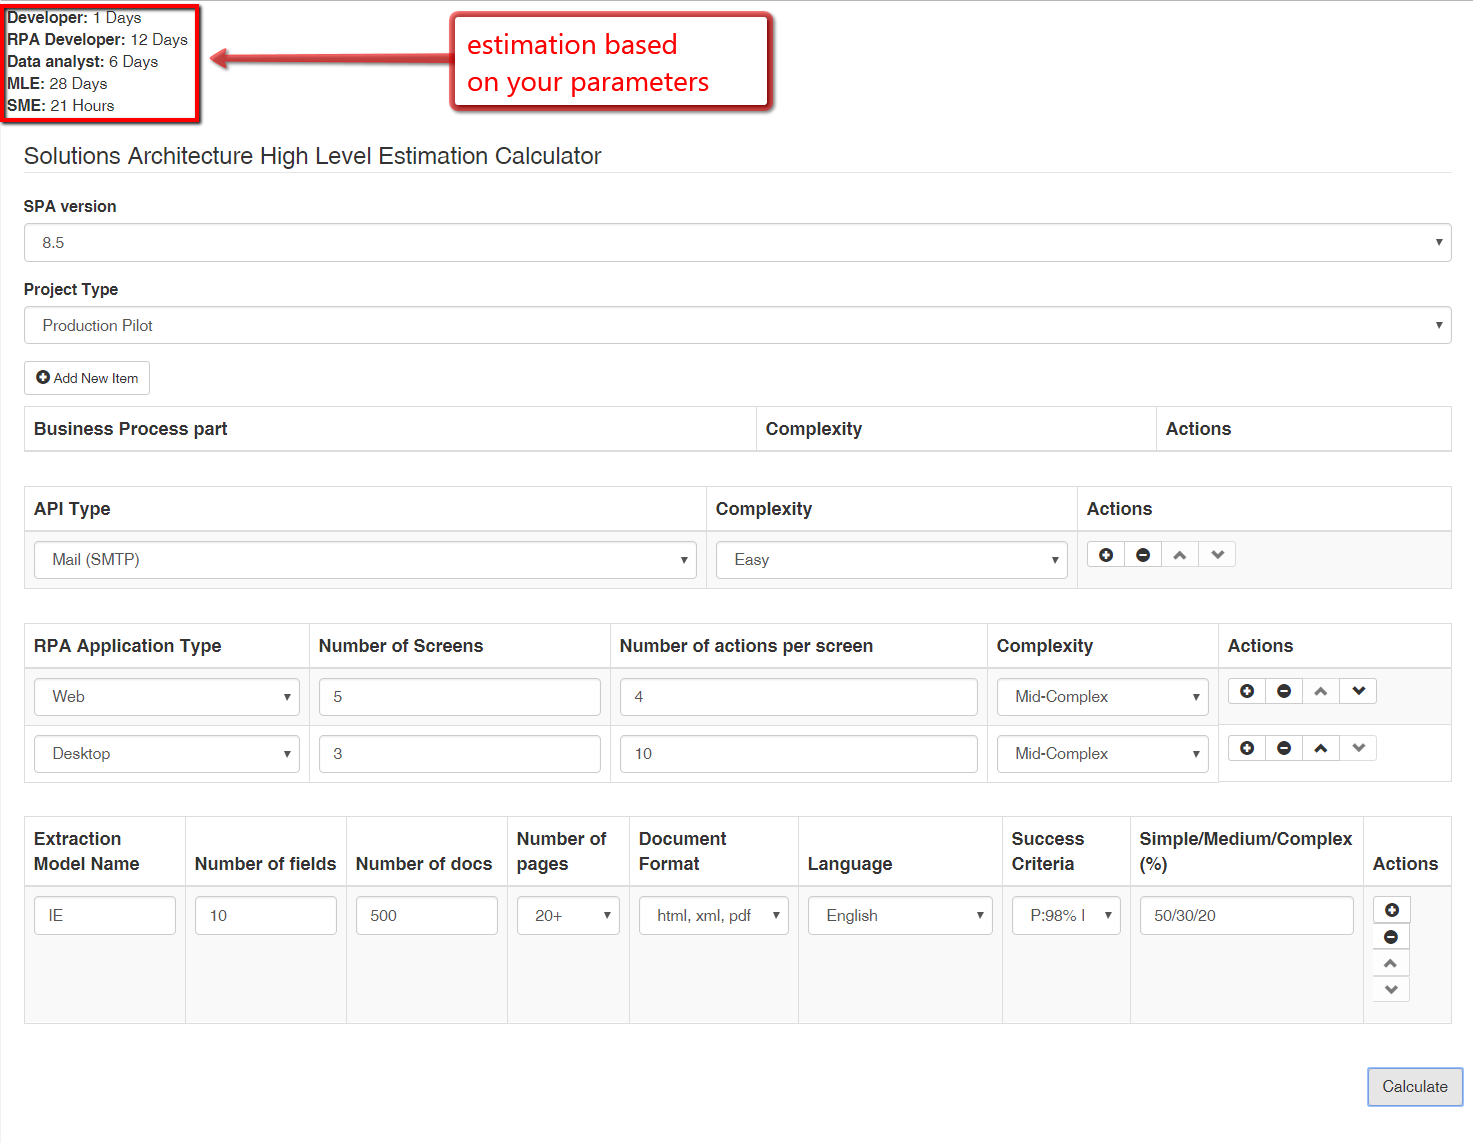
You can find web based calculator at http://wf.sharebox.s3.amazonaws.com/mturchyn/sa-calculator/sa-calculator.html