
Inspect tools for desktop automation
Overview
Web applications do not always confine themselves to working entirely on the web. Sometimes they need to interact with the desktop to do things like downloads & uploads. Automating these sorts of workflow is tricky in using Web Driver. Web driver is confined to automating browsers, so desktop windows are out of scope.
This article describes two main tools that leverage desktop automation by providing information from a specified window (title, class, instance) and all its controls (edit boxes, check boxes, list boxes, combos, buttons, status bars):
- Inspector is the main tool for inspecting desktop applications made by WorkFusion.
Inspect.exeis the tool from Microsoft (can be used as a debugging tool in case if Inspector does not provide information about some UI control).
Inspector
Inspector is a special Java application, which helps you find unique selectors for desktop windows and controls.
To start the Inspector, press CTRL + SHIFT + I or click the appropriate icon in WorkFusion Studio toolbar..
Working with Component Tree
On the left side of inspector window, you can find two sections: the top one shows active processes and the bottom one shows window’s components. On the right side, you can find the Search field, the Unique Descriptor text field and information about the selected component in the form of a table.
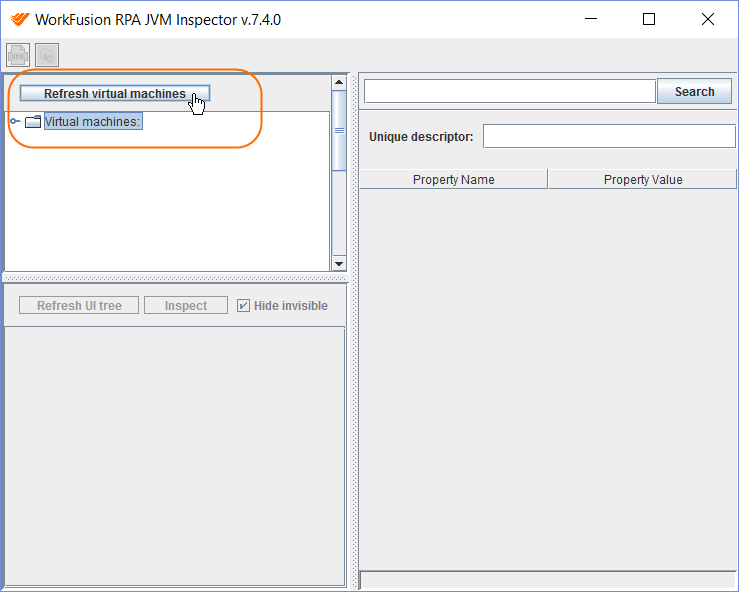
When some processes are running, you could find them in the left top tree: Virtual Machines.
If you launched your applet after launching the Inspector, click the Refresh virtual machines button.
If something is changed with a process or a current window (for example, an applet) you may use the Refresh virtual machines button and the Refresh UI tree button to update Inspector to the current state.
To connect to some window, expand target process (7928: sun.plugin2... on the screen below) and double-click the child window (JFrame [0x000C07EE] on the screen below).
Now, you can see that the bottom left tree (The Component Tree) has been updated and shows all the components of the selected window.Select a node in the Component Tree, and you will find information about this particular selected component on the right side of Inspector. Pay attention to the unique descriptor field. This descriptor can be copied to your machine configuration.
The target UI control will be highlighted.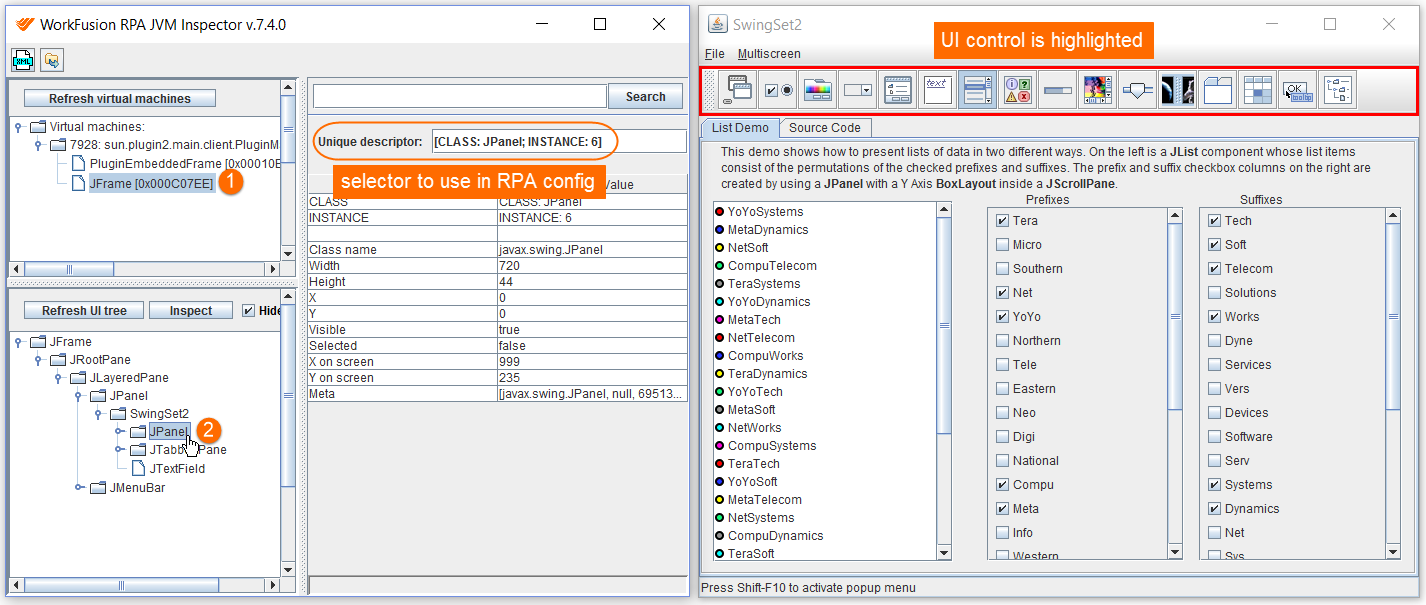
Using Search for Testing Descriptors
On the right side of the Inspector, you can also find a Search control used to test your descriptor and find out if it works before you put it to a machine configuration. To test a descriptor:
Copy your descriptor, for example,
[CLASS: JCheckBox; TEXT: Northern], to the Search for component… text field. You can also use a descriptor from the Unique descriptor text field for testing purposes.Click the Search button.
If the provided descriptor exists, Inspector will find the component according to the provided descriptor and select it in the Component Tree (left bottom tree) and will show you necessary information on the right side of the inspector’s window.
The target UI control will be highlighted.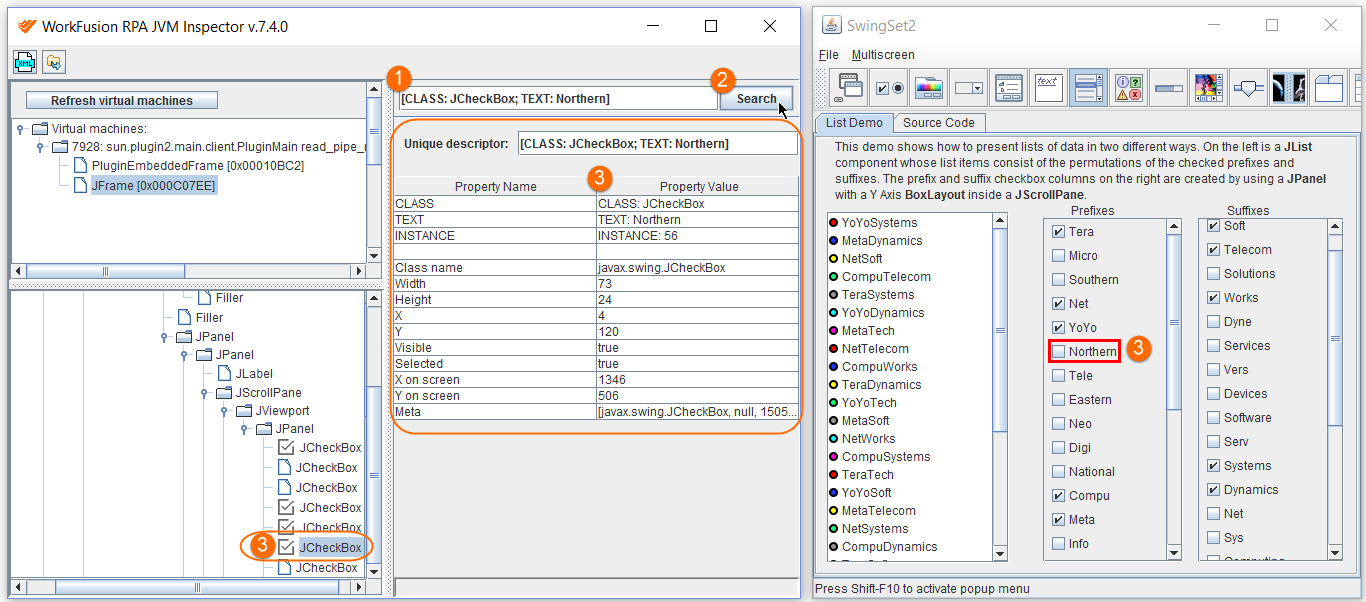
Inspecting UI Controls
Inspector also provides a functionality for quick element information search using hovering over an element or inspecting:
Click the Inspect button in the bottom left panel.
Hover over the UI element and press ESC. When you hover over an element, it is highlighted with a red border.
As a result:
- The target element is highlighted in the Component Tree.
- Unique descriptor and Component properties are displayed on the right panel of Inspector.
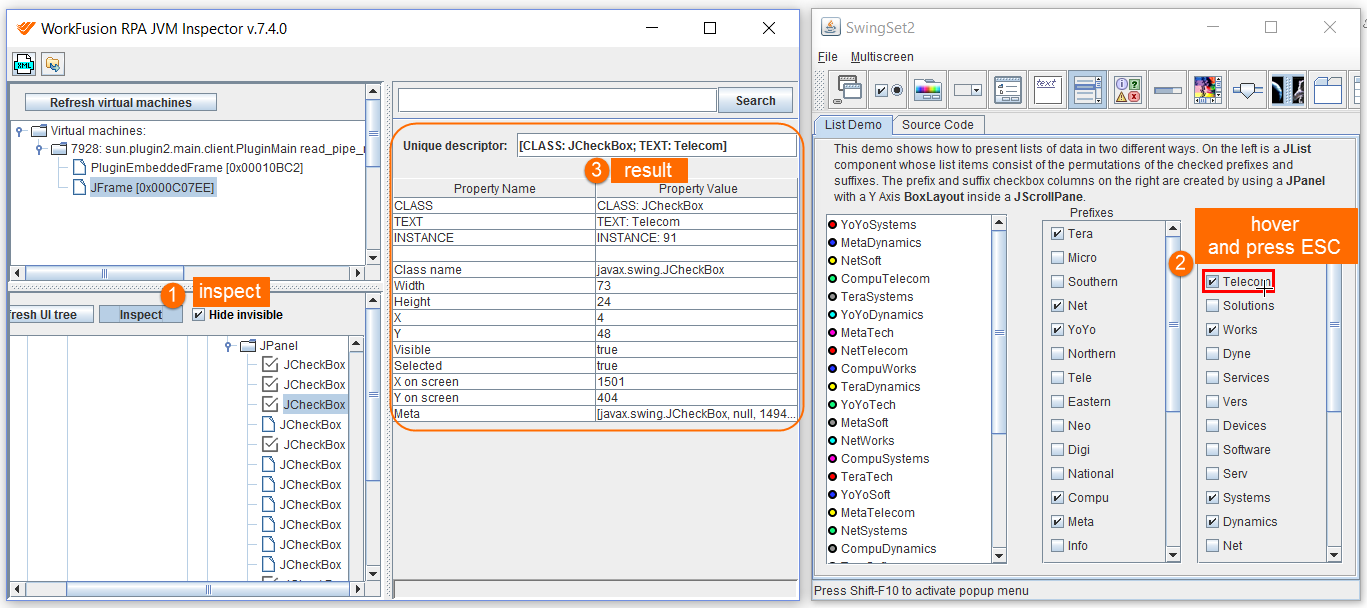
When you have found the target component and tested the descriptor of this component, copy the descriptor to the machine configuration: $("[CLASS:JCheckBox; Text:Telecom]").click()
Powerful Search selectors to find specific elements are as follows:
- CSS:
$(".ParentC .Child3 .JButton").click() - XPath:
$(byXpath("//element[@class=Child3]/element[@class=JButton")).click() - Combination of different selectors:
$("[XPATH: //element[@class=Child3]/element[@class=JButton]; NAME: Button Name; TEXT: Text Control]").click()
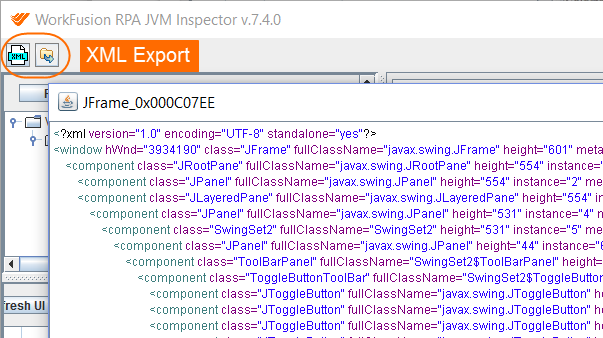
Use the XML export feature to obtain the XML file for building the selectors.
Exporting Component Tree to XML
You can also get the whole UI component tree and manipulate it in your text editor or IDE with the XML export feature.
When you have a file with XML export, you can try building CSS, XPath, or RegExp selectors to uniquely locate an element in your RPA script. For example: [XPATH: //element[@class=Child3]/element[@class=JButton]; NAME: ButtonName; TEXT: TextControl]
There are two options: open XML code in a new window or save it to a new file.
Inspect.exe
Inspect (Inspect.exe) is a Windows-based tool that enables you
select any UI element and view the element's accessibility data. You can
view Microsoft UI Automation properties and control patterns, as well as
Microsoft Active Accessibility properties. Inspect also enables you
to test the navigational structure of the automation elements in the UI
Automation tree, and the accessible objects in the Microsoft Active
Accessibility hierarchy.
Inspect is installed with the Windows Software Development Kit (SDK). (It is also available in previous versions of Windows SDK.) It is located in the \bin\<version>\<platform> folder of the SDK installation path (Inspect.exe).
tip
Troubleshooting
Wrong Java version
In case you are unable to setup RPA Package Java as default Java for IE (jdk/jre.exe installer can do that anyway), you'll need to load Java with build version which is not higher than the RPA Package one.
Having RPA Package Java version 8u92 and IE pointed to 8u101, -Inspector is unable to connect to 8u101 JVM and display elements selectors. Even when selector was found through different Machine, RPA Agent is unable to find it.
Installing 8u91 and pointing to IE fixes that issue. Inspector starts working and Selectors are executed successfully.
Robot cannot find element and Inspector not seeing other processes
Sometimes after Windows security updates your RPA agent stops finding elements and Inspector isn't detecting any java processes for inspection, in the command window instead of:
...inspector.controller.JvmInspectorControllerImpl.updateVirtualMachineTree[:73] - Updating JVM Tree...
...common.utils.VirtualMachineConnector$VMConnection.connect[:140] - Using jvmAgentPath =     c:\rpa\rpa-grid\dependency\rpa-jvmagent.jar
...inspector.controller.JvmInspectorControllerImpl.connectToJvmAndUpdateVmTree[:236] - Successfully connected     to: 23652
there are only updating JVM tree attempts:
bad
...inspector.controller.JvmInspectorControllerImpl.updateVirtualMachineTree[:73] - Updating JVM Tree...
...inspector.controller.JvmInspectorControllerImpl.updateVirtualMachineTree[:73] - Updating JVM Tree...
...inspector.controller.JvmInspectorControllerImpl.updateVirtualMachineTree[:73] - Updating JVM Tree...
You may start troubleshooting by looking at the C:/rpa/java/bin/jconsole.exe.
When you see that JConsole detects external processes, but can't get any information off them too, and the warning message: "The management agent is not enabled for this process".
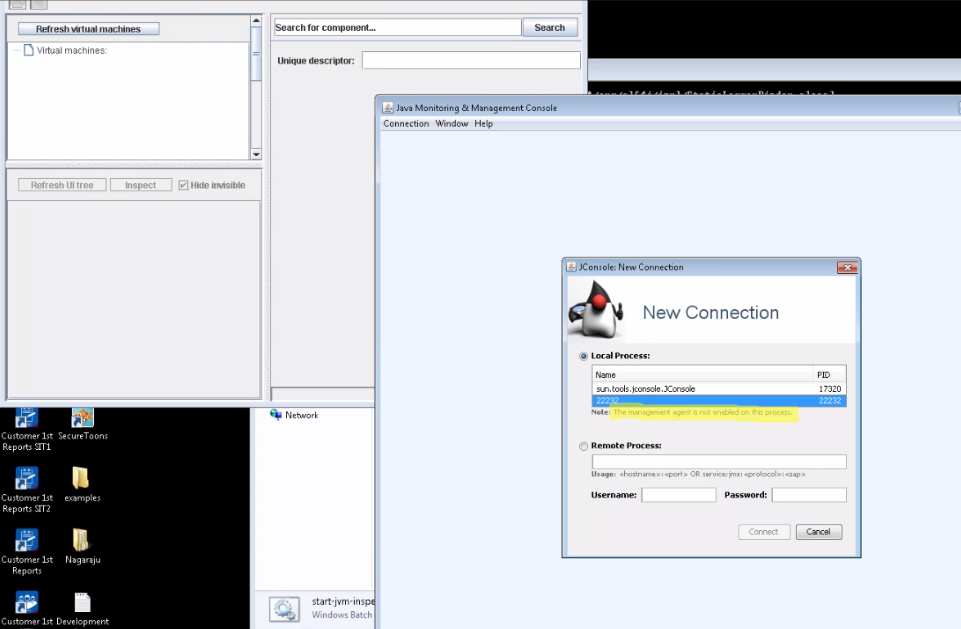
It means that JConsole can't access PID files created by a Java process.
To resolve the issues:
- Close all Java programs.
- Check where %TEMP% and %TMP% environment variables are pointed.
- Clean your TEMP folder, most likely,
C:/Users/{username}/AppData/Local/Temp. - Run
settings-rdp.regfrom the RPA setup folder. - Re-log in into your PC.
- Run all the Java programs, test with jconsole, and then use Inspector.
- Check if
C:/Users/{username}/AppData/Local/Temp/hsperfdata_{username}has files corresponding to Java process IDs.